The Diagnostics tab provides information about the end-systems and end-system groups connecting to your network.
Using third-party software (known as modules) in conjunction with the network monitoring and access control functionality found in the ExtremeControl solution, the Diagnostics tab provides information available about end-systems and end-system groups in your network.
The Diagnostics tab contains the following sub-tabs, each providing information about end-systems:
- End-Systems — Displays the end-systems detected for each module.
- End-System Groups — Displays the end-system groups detected for each module.
- Statistics — Displays various statistics about the time end-systems spent performing certain operations on the network.
End-Systems
The End-Systems tab provides information about the end-systems connecting to your network.
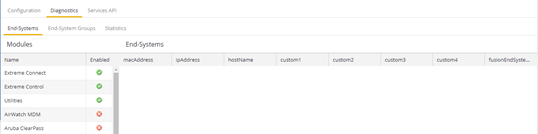
Left Panel
The left panel of the tab shows all of the modules available in the Connect tab.
The Enabled column indicates whether the module is enabled:
- Check icon (
 ) — Module enabled on your network.
 - X icon (
 ) — Module not enabled on your network.
Right Panel
The right panel of the tab shows a table with information about the end-systems. Add or remove a column by selecting the down arrow at the right of a column header and selecting a checkbox associated with a column from the Columns menu.
End-System Groups
The End-System Groups tab provides information about the end-system groups connecting to your network.
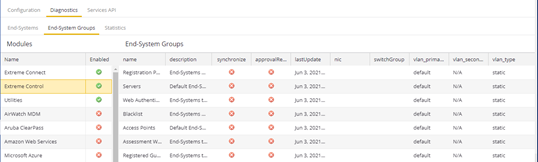
Left Panel
The left panel of the tab shows all of the modules available in the Connect tab.
The Enabled column indicates whether the module is enabled:
- Check icon () — Module enabled on your network.
- X icon () — Module not enabled on your network.
Right Panel
The right panel of the tab shows a table with information about the end-system groups. Add or remove a column by selecting the down arrow at the right of a column header and selecting a checkbox associated with a column from the Columns menu.
Statistics
Select the Statistics tab to view end-system statistics for each module.
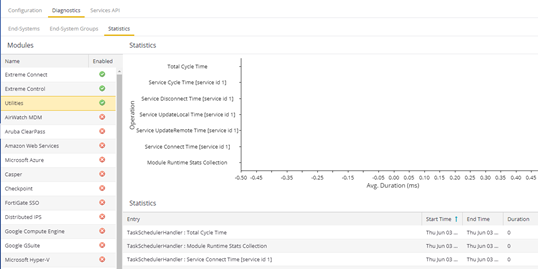
Left Panel
The left panel of the tab shows all of the modules available in the Connect tab.
The Enabled column indicates whether the module is enabled:
- Check icon () — Module enabled on your network.
- X icon () — Module not enabled on your network.
Right Panel
The right panel contains a table of the end-system statistics captured by the module and a bar graph displaying an average of the statistical entries contained in the table.
For information on related help topics:
![]()