The Analytics tab lets you view and customize ExtremeAnalytics reports and application flow data, as well as manage and configure your ExtremeAnalytics engines.
| NOTE: | ExtremeAnalytics reports and application flow data is not available unless an ExtremeAnalytics engine is configured and you are a member of an authorization group assigned the ExtremeCloud IQ Site Engine ExtremeAnalytics Read Access or Read/Write Access capability. |
Reports
In the Reports tab, you can access a selection of reports that provide detailed information on application usage on your network, as well as network activity statistics based on application, user name, client, and site. For many of the reports, you can select an item in the report to view details or right-click an item to select from other focused reports.
If you have multiple ExtremeAnalytics engines, use the Engine drop-down list to select an engine to use as the source for the report data. Then use the Report drop-down list to the right to access the different reports:
- Analytics Events
- Bandwidth for a Client Over Time
- Interface Top Applications Tree Map
- Sites Using the Most Bandwidth
- Most Popular Applications
- Most Used Applications for a Client
- Most Used Applications for a User Name
- Network Activity by Site
- Network Activity by Client
- Network Activity by Application
- Slowest Application by Site
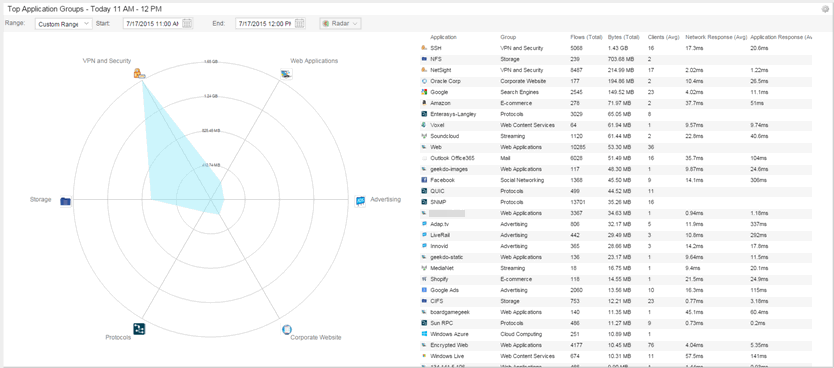
- Top Applications Group Radar
- Top Applications Radar
- Top Applications Tree Map
- Top Clients by Interface
- Top Interfaces by Application
- Top N Applications
- Top N Clients
- Top N Servers
In most of the reports, use the Gear button  (on the right side of the view) to display a Start Time option that allows you to change the length of the reporting period displayed. Depending on the report, you can also change the type and/or format of the data reported, and the number of results to return.
Some of the reports are based on a specific object (target), such as a user name, client, application, or site. In those reports, enter the required information and then select the Submit button to generate the report. You can enter a partial value in the text field or use the SQL wildcard "%" (as a substitute for multiple characters) or "_" (as a substitute for a single character) to generate a report with multiple matches.
| NOTE: | Values entered in the text fields that contain multiple, non-alphanumeric characters can cause issues with the returned results. If this happens, use alternate values. |
For information on related help topics: