Stream Flow Data from ExtremeAnalytics into Elastic Stack
ExtremeAnalytics includes the ability to stream flow data from an ExtremeAnalytics engine to Elastic Stack (aka ELK stack). To help you use Elastic Stack with ExtremeAnalytics, we added an ELK directory to the ExtremeCloud IQ Site Engine NetSight/appdata/Purview directory.
The ELK directory contains the following:
- A PDF describing how to add the open-source “Elastiflow” module to an ELK server and how to update this deployment to make Elastiflow aware of Extreme’s IPFIX format.
- Files that you can copy to the ELK server to assist with the customization.
Use the procedures in this section to send Extreme Networks-enriched network flow data to Elastic Stack using IPFIX and ElastiFlow.
Environment
- Extreme Management Center 8.2 and later
- Elastic Stack 6.7 (single server deployment) and later
- ElastiFlow 3.4.2 and later (version compatible with Elastic Stack 6.7) running on Ubuntu Server 18.04
Overview
Use ElastiFlow to collect IPFIX flow data and visualize the results using Elastic Stack. ElastiFlow requires a working Elastic Stack and it must be configured by editing text files on the file system and by using the Kibana user interface.
The installation steps assume that IPFIX will only be sent over UDP on port 2055 from ExtremeCloud IQ Site Engine. After making the file system and UI changes, you must restart the Elastic Stack components. Finally, enable and deploy the IPFIX exporter of ExtremeAnalytics from the ExtremeCloud IQ Site Engine user interface.
Part 1 – Installing and Configuring ElastiFlow and Elastic Stack
ElastiFlow installation instructions can be found at:
Other helpful installation links are:
- https://www.catapultsystems.com/blogs/install-elastiflow-on-ubuntu-18-04-part-1/
- https://sadsloth.net/post/elastiflow-ubuntu1804/
-
Download and install the Oracle Server JRE 8 in one of the following ways:
- Via the Ubuntu bundle by entering the following commands:
$ sudo apt install openjdk-8-jre
Verify Oracle Server JRE 8 is installed properly by entering the following:
$ java -version
openjdk version "1.8.0_212"
OpenJDK Runtime Environment (build 1.8.0_212-8u212-b03-0ubuntu1.18.04.1-b03)
OpenJDK 64-Bit Server VM (build 25.212-b03, mixed mode)
- Via the external Java web site by following the instructions at:
https://www.oracle.com/technetwork/java/javase/downloads/server-jre8-downloads-2133154.html
- Via the Ubuntu bundle by entering the following commands:
- Install Elastic Stack 6.7 (6.7.2 at time of writing) by entering the following commands:
wget -qO - https://artifacts.elastic.co/GPG-KEY-elasticsearch | sudo apt-key add
echo "deb https://artifacts.elastic.co/packages/6.x/apt stable main" | sudo tee -a
/etc/apt/sources.list.d/elastic-6.x.list
- Install Elastic Search:
sudo apt update; sudo apt -y install elasticsearch(You might need to runsudo apt-get -f installto update packages before you can installelasticsearch.)sudo /bin/systemctl daemon-reload sudo /bin/systemctl enable elasticsearch.service sudo systemctl start elasticsearch.service Install Kibana:
sudo apt -y install kibana

sudo /bin/systemctl daemon-reload
sudo /bin/systemctl enable kibana.service

sudo systemctl start kibana.service
Install Logstash:
sudo apt -y install logstash
- Install Elastic Search:
- Configure Elastic Stack components.
Configure Elasticsearch:
sudo nano /etc/elasticsearch/elasticsearch.yml
Change
#network.host: 192.168.0.1tonetwork.host: localhost
Save the file.Configure Kibana:
WARNING: The following changes enable external access to Kibana. You must follow best practices to restrict public access to the system. sudo nano /etc/kibana/kibana.yml
Change
#server.host: “localhost”toserver.host: “YOUR_KIBANA_SERVER_IP”.
Save the file.sudo systemctl restart kibana
The default port for the Kibana’s server is tcp port 5601. Create a firewall rule to enable user access to the Kibana server. The rule should be something like:
sudo ufw allow from YOUR_MANAGEMENT_SUBNET to any port 5601 proto tcp
Configure Logstash:
Edit JVM setting in
/etc/logstash/jvm.options.sudo nano /etc/logstash/jvm.options
Change
-Xms1gto-Xms4g.
Change-Xmx1gto-Xmx4g.
Save the file.Add required Logstash plugins.
sudo /usr/share/logstash/bin/logstash-plugin update logstash-codec-netflow;
sudo /usr/share/logstash/bin/logstash-plugin update logstash-input-udp;
sudo /usr/share/logstash/bin/logstash-plugin update logstash-filter-dns;
sudo /usr/share/logstash/bin/logstash-plugin update logstash-filter-geoip;
sudo /usr/share/logstash/bin/logstash-plugin update logstash-filter-translate
-
Download and extract ElastiFlow v3.4.2.
tar.gzto/usr/local/src.wget https://github.com/robcowart/elastiflow/archive/v3.4.2.tar.gz
sudo tar xvzf v3.4.2.tar.gz -C /usr/local/src -
Copy logstash configuration.
cd /usr/local/src
sudo cp -arv elastiflow-3.4.2/logstash/elastiflow/. /etc/logstash/elastiflow -
Merge Extreme Networks specific IPFIX definitions with ElastiFlow.
- To prepare for this step, copy the
extr_elastiflow_3.4.2.tar.gzfile to the/etc/logstashdirectory. cd /etc/logstash sudo tar xvzf extr_elastiflow_3.4.2.tar.gz
- To prepare for this step, copy the
-
Configure logstash
pipelines.yml.sudo nano /etc/logstash/pipelines.yml-
Add:
- pipeline.id: elastiflowpath.config: "/etc/logstash/elastiflow/conf.d/*.conf"
NOTE: Be careful about spacing and extra blank lines with the following file. Make sure there are no blank lines between the main definition and the elastiflowdefinition.- pipeline.id: main
path.config: "/etc/logstash/conf.d/*.conf"
- pipeline.id: elastiflow
path.config: "/etc/logstash/elastiflow/conf.d/*.conf"Do not add a <CR> at the end of the file.
Save the file.The following configuration example receives Extreme Networks-enriched IPFIX on UDP port 2055 only. We can modify the Logstash configuration and service parameters to limit the Logstash plugins that are loaded.
To prepare for this step, copy the
extr_udp_2055_logstash.tar.gzfile to the/directory.cd /
sudo tar xvzf extr_udp_2055_logstash.tar.gz
cd /etc/logstash/elastiflow/conf.d
sudo mv 10_input_netflow_ipv4.logstash.conf 10_input_netflow_ipv4.logstash.conf.disabled;
sudo mv 10_input_sflow_ipv4.logstash.conf 10_input_sflow_ipv4.logstash.conf.disabled;
sudo mv 20_filter_20_netflow.logstash.conf 20_filter_20_netflow.logstash.conf.disabled;
sudo mv 20_filter_40_sflow.logstash.conf 20_filter_40_sflow.logstash.conf.disabled; -
To prevent packet drops:
sudo cp -arv /usr/local/src/elastiflow-3.4.2/sysctl.d/87-elastiflow.conf /etc/sysctl.d/.To apply sysctl changes without restart:
sudo sysctl --system -
Set up Kibana index patterns.
- Download https://github.com/robcowart/elastiflow/archive/v3.4.2.tar.gz to the computer that you will use to view ElastiFlow.
- Extract the files to a temporary directory.
- In the web browser, go to http://YOUR_KIBANA_SERVER_IP:5601.
- In the Kibana UI, select Management on the left side of the screen and then Saved Objects.
- Select Import.
- Select
elastiflow-3.4.2\kibana\elastiflow.kibana.6.7.x.json. - Select Import.
-
Start Logstash:
sudo /usr/share/logstash/bin/system-install
sudo systemctl daemon-reload
sudo systemctl start logstash- Run
sudo tail -f /var/log/logstash/logstash-plain.logto see messages from Logstash.
It is normal to see info messages such as the following in the log:[INFO ][logstash.config.source.local.configpathloader] No config files found in path {:path=>"/etc/logstash/conf.d/*.conf"}
Depending on your system, it can take a few minutes for Logstash to start up. When it starts, you should see a message that says:
Successfully started Logstash API endpoint. -
Go to https://github.com/robcowart/elastiflow/blob/master/INSTALL.md and perform “Recommended Kibana Advanced Settings.”
Part 2 – Configuring each Analytics Engine to export IPFIX data to the Elastic Stack server
- Log in to the ExtremeCloud IQ Site Engine.
- Navigate to Analytics > Configuration.
- Use the following steps for each engine that you want exporting flows to ElastiFlow:
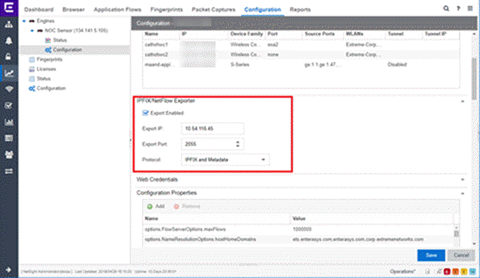
- Select the engine's Configuration page.
- Expand the IPFIX/Netflow Exporter section.
- Fill out the required fields:
Set Export IP to the Logstash IP address.
Set Export Port to 2055.
Set Protocol to either IPFIX or IPFIX and Metadata.
Metadata contains some protocol-specific data for the analysis of DNS, HTTP, etc. This additional data can double the size of the records.
-
Enforce the changes.
You should seeIpfixdatain ElastiFlow within a minute or two. -
Go to Kibana at http://YOUR_KIBANA_SERVER_IP:5601.
- Select Dashboard.
- Select ElastiFlow: Overview.
You should see some data. -
The Logstash log file displays the following message:
… [WARN ][logstash.codecs.netflow ] Can't (yet) decode flowset id xxx from observation domain id xxxx, because no template to decode it with has been received.
This message is normal. It goes away after one minute when Logstash receives the IPFIX data template, and this message will stop being added to the log file.
Appendix: Files
Additions to ipfix.yml in extr_elastiflow_3.4.2.tar.gz
# Extreme Networks (formerly 'Enterasys')

  1916:
	0:
	- :skip
	371:
	- :string
	- :extr_userName
	372:
	- :string
	- :extr_appGroupName
	1000:
	- :string
	- :extr_srcHostName
	1001:
	- :string
	- :extr_dstHostName
	1002:
	- :uint64
	- :extr_netResponseTime
	1003:
	- :uint64
	- :extr_appResponseTime
	1004:
	- :ip4_addr
	- :extr_serverAddress
	1005:
	- :string
	- :extr_nacProfile
	1006:
	- :string
	- :extr_detailedLocation
	1007:
	- :uint8
	- :extr_oneSidedFlow
	1008:
	- :string
	- :extr_clientLocation
	1009:
	- :string
	- :extr_serverLocation
	1010:
	- :string
	- :extr_metaData
Additions to elastiflow.template.json and elastiflow_dynamic.template.json in extr_elastiflow_3.4.2.tar.gz
{
	"ipfix.extr_userName": {
	"path_match": "ipfix.extr_userName",
	"mapping": {
	"type": "keyword"
      }
    }
  },
  {
	"ipfix.extr_appGroupName": {
	"path_match": "ipfix.extr_appGroupName",
	"mapping": {
	"type": "keyword"
      }
    }
  },
  {
	"ipfix.extr_srcHostName": {
	"path_match": "ipfix.extr_srcHostName",
	"mapping": {
	"type": "keyword"
      }
    }
  },
  {
	"ipfix.extr_dstHostName": {
	"path_match": "ipfix.extr_dstHostName",
	"mapping": {
	"type": "keyword"
      }
    }
  },
  {
	"ipfix.extr_netResponseTime": {
	"path_match": "ipfix.extr_netResponseTime",
	"mapping": {
	"type": "long"
      }
    }
  },
  {
	"ipfix.extr_appResponseTime": {
	"path_match": "ipfix.extr_appResponseTime",
	"mapping": {
	"type": "long"
      }
    }
  },
  {
	"ipfix.extr_serverAddress": {
	"path_match": "ipfix.extr_serverAddress",
	"mapping": {
	"type": "ip"
      }
    }
  },
  {
	"ipfix.extr_nacProfile": {
	"path_match": "ipfix.extr_nacProfile",
	"mapping": {
	"type": "keyword"
      }
    }
  },
  {
	"ipfix.extr_detailedLocation": {
	"path_match": "ipfix.extr_detailedLocation",
	"mapping": {
	"type": "keyword"
      }
    }
  },
  {
	"ipfix.extr_oneSidedFlow": {
	"path_match": "ipfix.extr_oneSidedFlow",
	"mapping": {
	"type": "long"
      }
    }
  },
  {
	"ipfix.extr_clientLocation": {
	"path_match": "ipfix.extr_clientLocation",
	"mapping": {
	"type": "keyword"
      }
    }
  },
  {
	"ipfix.extr_serverLocation": {
	"path_match": "ipfix.extr_serverLocation",
	"mapping": {
	"type": "keyword"
      }
    }
  },
  {
	"ipfix.extr_metaData": {
	"path_match": "ipfix.extr_metaData",
	"mapping": {
	"type": "keyword"
      }
    }
  },
Additions to elastiflow_static.template.json in extr_elastiflow_3.4.2.tar.gz
  "extr_userName": {
	"type": "keyword"
    },
    "extr_appGroupName": {
	"type": "keyword"
    },
    "extr_srcHostName": {
	"type": "keyword"
    },
    "extr_dstHostName": {
	"type": "keyword"
    },
    "extr_netResponseTime": {
	"type": "long"
    },
    "extr_appResponseTime": {
	"type": "long"
    },
    "extr_serverAddress": {
	"type": "ip"
    },
    "extr_nacProfile": {
	"type": "keyword"
    },
    "extr_detailedLocation": {
	"type": "keyword"
    },
    "extr_oneSidedFlow": {
	"type": "long"
    },
    "extr_clientLocation": {
	"type": "keyword"
    },
    "extr_serverLocation": {
	"type": "keyword"
    },
    "extr_metaData": {
	"type": "keyword"
    },