ExtremeCloud IQ Site Engine Reports provide historical and real-time reporting, offering high-level network summary information as well as detailed reports and drill-downs.
Reports Features
ExtremeCloud IQ Site Engine reports include the following features (depending on the report selected):
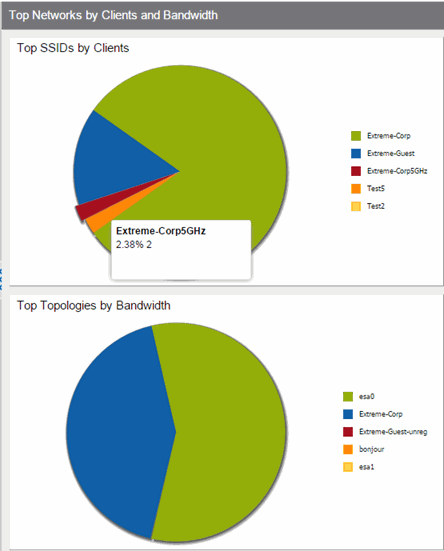
- Hover Over for Info — Hover over a pie section to display the name of the segment, the percentage represented by the segment and the number of elements. for some reports, selecting a pie section opens a filtered end-systems grid for more detailed information.
- Drill-down for Details — Link to summary reports containing more detailed information.
For example, in the Controller Summary report, selecting a controller shows a
detailed report for that controller over time.
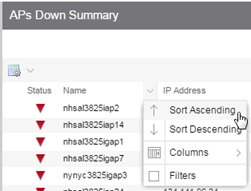
- Interactive Tables — Manipulate table data
in several ways to customize the view for your own needs:
- Select the column headings to perform an ascending or descending sort on the column data.
- Hide or display different columns by selecting a column heading drop-down arrow and selecting the column options from the menu.
- Filter, sort, and search the data
in each column
in the table.
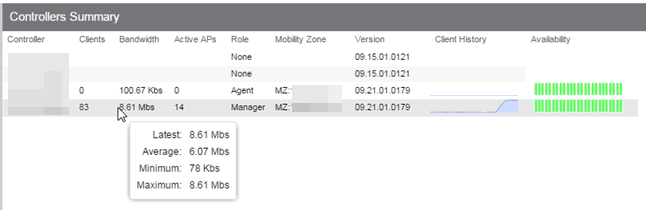
- Interactive Charts — Use data-point rollovers for quick information on chart data. For example, in the Controller Summary report, rolling over the value reported
for Bandwidth provides additional bandwidth statistics over time.
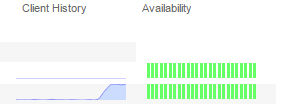
- Sparkline Charts — View network trends in dense, succinct charts that present
report data in an easy to read, condensed format. This provides you with a quick way to catch
possible problem areas that you can investigate further. Rollover charts for additional
information.
- CSV Export
 —
Save report
data to a file in CSV format to provide report data in table form.
—
Save report
data to a file in CSV format to provide report data in table form.
For information on related help topics: