NAC Manager and ExtremeControl Troubleshooting in ExtremeCloud IQ Site Engine
The following sections provide information on tools used when troubleshooting NAC Manager and ExtremeControl engine issues.
NAC Manager Event Logging
The Event View at the bottom of the NAC Manager main window displays error and informational messages about NAC Manager operations and provides information on end-systems attempting to connect to the network through an ExtremeControl engine.
NAC Manager Event View

There are four tabs:
- NAC Manager Events – This tab displays error and informational messages about NAC Manager system operations, including configuration changes and enforce operations.
Use this tab when trying to locate forensic information such as when and who made changes to the ExtremeControl configuration, and when and for how long communication with an ExtremeControl engine was lost. This event log also captures NAC Manager functional and security-related warnings that the system issues when auditing its own configuration, as well as events tied to data persistence checks, including which end-systems were removed and when.
Important system notification messages are also logged here, including when new agent-less assessment updates are available and when certain system default credentials should be changed. - End-Systems Activity – This tab provides information on all the end-systems that have attempted to connect to the network. It displays all end-system activity since the client was launched.
- NAC Appliance Events – This tab provides information on ExtremeControl engine system events including RADIUS configuration success or failure, completed reauthentications, and management logins (such as Telnet or SSH configured for external authentication). The event log displays engine activity since the NAC Manager client was launched and like NAC Manager Events, is an excellent source for historical information when performing a forensic investigation of a recent event.
- Audit Events – This tab provides information on ExtremeControl Registration events such as when a device or user is added during the registration process, or an end-system is added, removed, or updated via the registration administration web page. It displays all registration activity since the client was launched.
ExtremeControl Engine Real-time Status
Use the following tools to monitor ExtremeControl engine real-time statistics, as well as view diagnostic information in the ExtremeControl engine Administration Web Page (WebView), and ExtremeControl information in the ExtremeCloud IQ Site Engine Administration tab.
NAC Appliances Tab
The NAC Appliances tab provides CPU and memory utilization statistics for all your ExtremeControl engines. The CPU Load column shows the percentage of the engine's CPU that is currently being used. This value gives you an indication of how busy the engine is and helps you determine if your network needs additional engines, or if you need to change your network configuration so that the load is more evenly distributed among your existing engines.
NAC Appliances Tab

In addition to the information in the table, you can launch two FlexViews with CPU, memory, and disk utilization information from the right-click menu off one or more engine in the NAC Appliances tab.
Launch the CPU Utilization View (Host Processor Load FlexView).
Host Processor Load FlexView

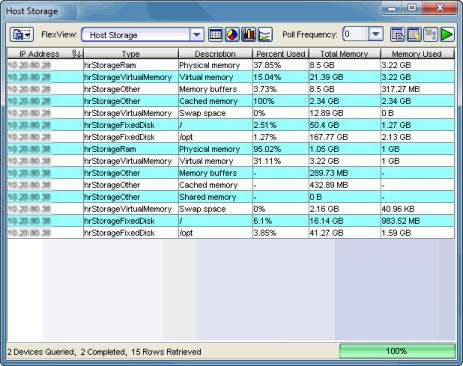
Launch the Memory and Diskspace Utilization View (Host Storage FlexView).
Host Storage FlexView
ExtremeControl Engine Administration Web Page (WebView)
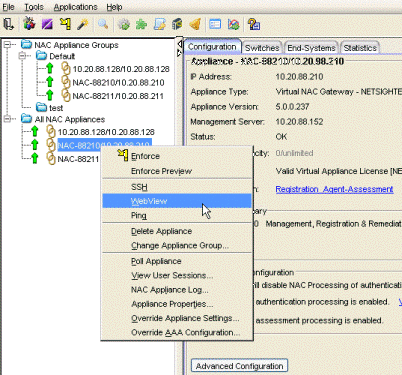
To access status and diagnostic information for an individual ExtremeControl engine, launch WebView by right-clicking on an ExtremeControl engine in the left-panel tree, as shown below. (You can also access the administration web page using the following URL: https://<ExtremeControlEngineIP>:8444/Admin.)
The default user name and password for access to this web page is "admin/Extreme@pp." The username and password can be changed in NAC Manager using the Advanced Configuration window (available from the Tools menu > Manage Advanced Configurations) and selecting the Engine Settings > Miscellaneous Tab > Web Service Credentials field.
Launch WebView
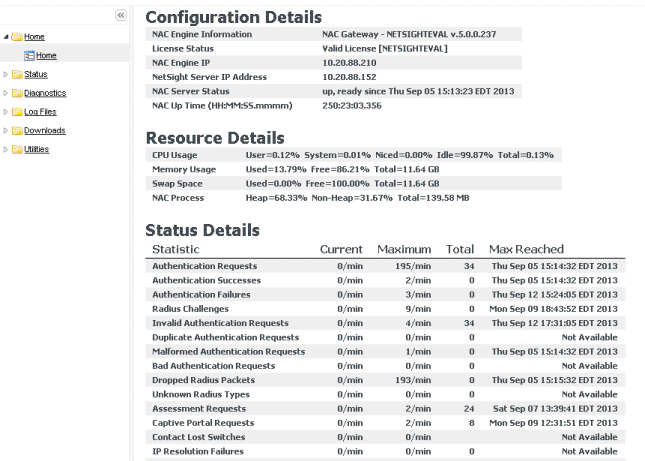
The Home web page provides resource details such as current CPU and memory usage. Status details provide a Current and Maximum counter for many critical functions. Excessive authentication requests or failures are easily identified, including when the Max Reached value occurred. This helps to identify the severity of a current problem or match information with prior events when performing a forensic review.
| NOTES: |
Memory usage is normally close to 100% to enable better performance. |
|---|
Engine Administration Web Page
For more information, see the ExtremeControl Engine Administration Web Page section of the ExtremeControl Deployment Guide, which is in the NAC Manager user guide.
ExtremeControl Switches and Routers
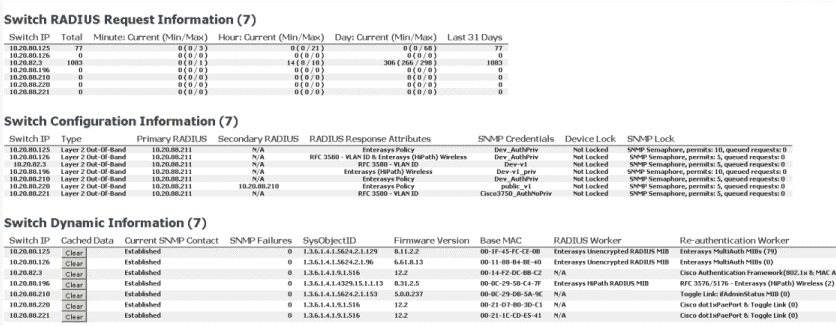
When troubleshooting issues involving authentication, IP resolution, and reauthentication (etc.), the Switches & Routers page within WebView provides a variety of useful real-time data.
At the top, current and historical information is displayed on a per-switch basis. This provides insight into problems such as a single switch flooding the network with authentication requests, as well as comparative data that can be used to spot abnormalities such as a switch with a limited number of active end-systems showing an excessive number of authentications over the last month.
The Switch Configuration section is an overview of all switches assigned to the ExtremeControl engine, the RADIUS response attributes they are configured for, and the SNMP credential the ExtremeControl engine is using to communicate with the switch. This information can be used to identify whether the ExtremeControl engine is using the current SNMP credentials to contact the switch. This can be confirmed under the Switch Dynamic Information where SNMP Contact will show as Contact Lost.
More critical information here, although perhaps more useful for support technicians, are the various workers assigned to each switch. These are dictated through the switch discovery process and detail how the ExtremeControl engine performs various functions such as using RFC 3576 or Toggle Link for reauthentication of an end-system. The SNMP Contact is from the perspective of the ExtremeControl engine to the switch, which can be different than from ExtremeCloud IQ Site Engine Console to the switch.
Engine Administration Web Page
ExtremeCloud IQ Site Engine Administration - Identity and Access
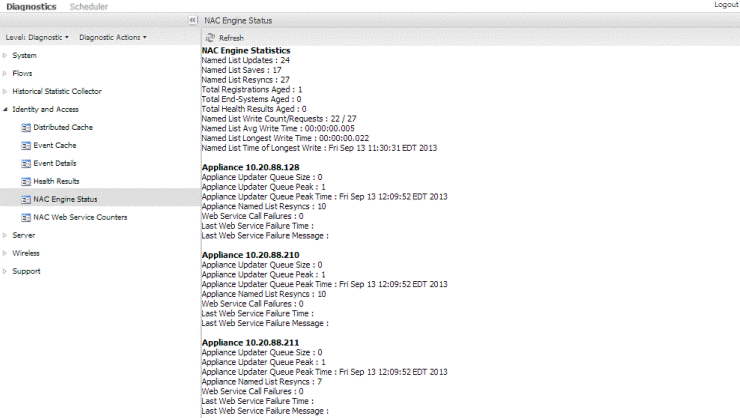
The Administration tab in ExtremeCloud IQ Site Engine has an Identity and Access section that provides detailed diagnostic and statistical information pertaining to advanced ExtremeControl functions. Information on web service calls, events, and distributed cache can be reviewed for signs of unexpected or failing processes.
Most of the information is useful to Engineering and Support technicians. More information is available under System-Wide ExtremeCloud IQ Site Engine Server Diagnostics in the ExtremeCloud IQ Site Engine Troubleshooting section of the ExtremeCloud IQ Site Engine Technical Reference.
Administration Tab
ExtremeControl Status
The NAC Status option (previously available from the NAC Appliances tab) has been updated and replaced by the ExtremeCloud IQ Site Engine Show Support functionality described in the ExtremeCloud IQ Site Engine Troubleshooting section of the ExtremeCloud IQ Site Engine Technical Reference.
The nacstatus command is still available from the ExtremeControl engine CLI and can be executed to provide detailed data regarding the ExtremeControl engine. However, the Show Support function is the recommended data collection vehicle, as it provides a comprehensive look into both the operation of the server as well as all active ExtremeControl engines.
End-System Troubleshooting
Use the following tools to monitor and trouble-shoot end-system issues in NAC Manager.
End-System Events in NAC Manager
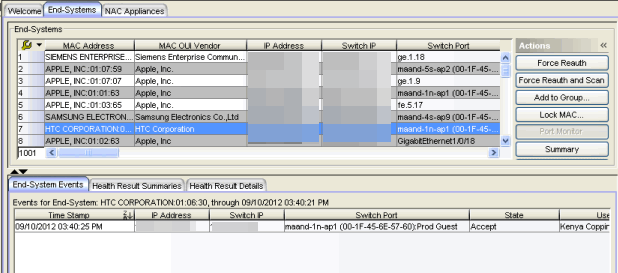
Troubleshooting specific end-system issues starts with end-system events. Events provide time-stamped logs of when specific events occurred. It is helpful to correlate these events with diagnostic log data.
NAC Manager End-Systems Tab
Engine End-System Diagnostics
To access end-system diagnostic information for a specific ExtremeControl engine, launch the ExtremeControl engine administration web page by right-clicking on an ExtremeControl engine in the left-panel tree and selecting WebView, as shown below. (You can also access the administration web page using the following URL: https://<ExtremeControlengineIP>:8444/Admin.)
The default user name and password for access to this web page is "admin/Extreme@pp." The username and password can be changed in NAC Manager using the Advanced Configuration window (available from the Tools menu > Manage Advanced Configurations) and selecting the Engine Settings > Miscellaneous Tab > Web Service Credentials field.
Launch WebView

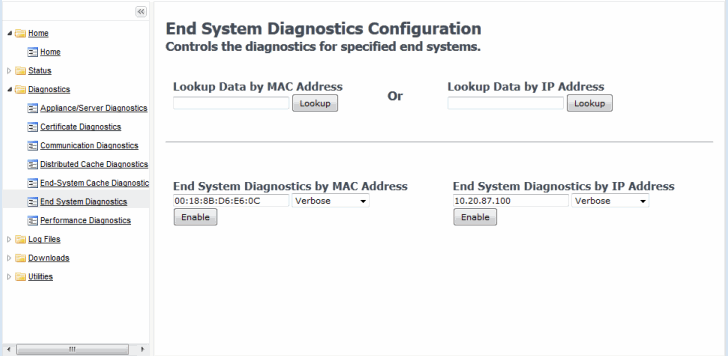
Expand the Diagnostics folder and select End System Diagnostics. Enable diagnostics for both MAC and IP address.
Targeting diagnostics for a specific end-system enables a majority of the debug diagnostics available on a global level, but only for the specific end-system. Therefore, diagnostics can be enabled for an extended period of time without the concern of generating the excessive log files that are possible when global diagnostics are enabled.
The log data is saved to the same location as the global diagnostics, in the /var/log/tag.log file of the ExtremeControl engine. A log entry is made in the tag.log helping to locate the portion of the log from which to start a review.
2013-09-13 14:51:20,783 INFO [ESD] Enabling verbose diagnostics for MAC: 00-18-8B-D6-E6-0C
2013-09-13 14:51:38,195 INFO [ESD] Enabling verbose diagnostics for IP: 10.20.87.100
Engine End-System Diagnostics
End-System Diagnostic Information
There are a variety of end-system troubleshooting tools available in NAC Manager by right-clicking on an end-system.
Launch End-System Diagnostic Tools
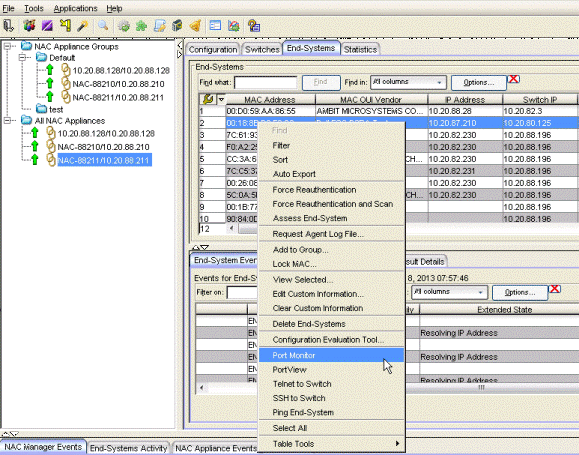
- Configuration Evaluation Tool - Test the rules defined in your ExtremeControl Configuration in order to determine what behavior an end-system will encounter when it is authenticated on an ExtremeControl engine.
- Port Monitor - View detailed port and switch status information for the selected end-system including: information from interface statistics, CoS and authentication information, the Reauth Interval and Quiet Period, the interface PVID, and errors on the port.
- PortView - View a variety of detailed port information and statistics presented in a network topology view. PortView displays the end-system in a graphical view based on how it connects to the network. From here, tabs are available that provide interface statistics, switch resource data, detailed ExtremeControl end-system information, as well as flow data, if enabled. A right-click on the switch opens menu options to drill into more specific switch-related data. For wireless end-systems, a Real Capture can be launched from this view providing real-time packet capture of end-system communications.
- Telnet to Switch - Launches a Telnet session to the switch the end-system is connected to.
- SSH to Switch - Launches a Secure Shell (SSH) session to the switch the end-system is connected to.
- Ping End-System - Open a window where you can ping the end-system to determine if it can be contacted. You can view the results of the ping in the log in the window. You can also select Clear to enter another IP address or host name, if you wish.
5/2026
26.02.13 Revision -00
Contents Subject to Change Without Notice