ExtremeCloud IQ Site Engine Troubleshooting
The following sections provide information on tools that can be used when troubleshooting ExtremeCloud IQ Site Engine server issues.
- System-Wide ExtremeCloud IQ Site Engine Server Diagnostics
- ExtremeCloud IQ Site Engine Server Real-Time CPU and Memory Usage
- ExtremeCloud IQ Site Engine Server Disk Utilization
- ExtremeCloud IQ Site Engine Server Diagnostics
- Generate a Show Support Report
System-Wide ExtremeCloud IQ Site Engine Server Diagnostics
The Administration tab in ExtremeCloud IQ Site Engine provides detailed statistical and diagnostic information regarding the overall performance and operation of significant ExtremeCloud IQ Site Engine server functions. It is important to review all the reports available on the Administration tab (Diagnostics sub-tab) so that they can be leveraged when diagnosing and troubleshooting problems.
There are three levels of information available: Basic, Advanced, and Diagnostic. The Basic level provides reports indicating the overall status of the server. Increasing the level to Diagnostic adds additional reports providing more granular insight into the overall operation of the server.
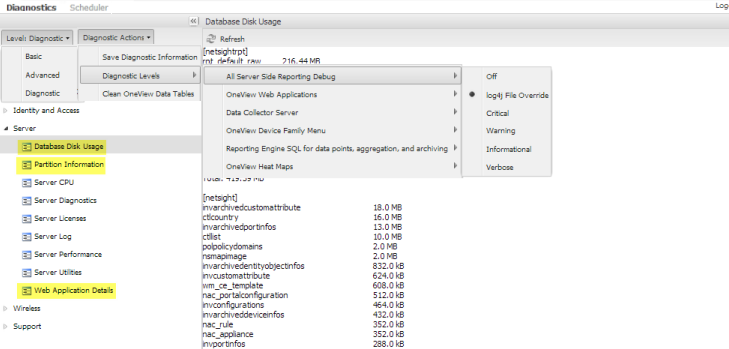
For example, the Diagnostic level adds reports on Database Disk Usage, Partition Information, and Web Application Details, providing in-depth information such as how much each ExtremeCloud IQ Site Engine component contributes to the overall size of the server database, and DWR statistics including the number of calls made and the average time to complete.
The Diagnostic level also includes a menu of Diagnostic Actions which provide the ability to Save Diagnostic information (similar to the Show Support function) and also enable additional advanced diagnostic logging levels. (Note: As with any diagnostics, care should be taken when enabling increased diagnostic logging and is advised only with the guidance of an Extreme Networks Support Engineer.)
Administration Tab Diagnostics
ExtremeCloud IQ Site Engine Server Real-Time CPU and Memory Usage
Troubleshooting ExtremeCloud IQ Site Engine server performance issues related to CPU and memory utilization is easier when you can refer to a CPU utilization baseline that was charted over a period of time.
Knowing the system's normal operating behavior makes it easier to identify when the server's behavior deviates from the norm and when exactly the change occurred. It also makes it easier to identify whether the deviation corresponds to a recent change on the system or network.
For more information on how to establish a baseline, see the Track ExtremeCloud IQ Site Engine Server CPU/Memory Trends section under Monitor ExtremeCloud IQ Site Engine Server Health.
When you have your baseline, use these four tools to monitor the ExtremeCloud IQ Site Engine server CPU and memory usage in real-time and compare that data to the baseline.
Linux "top" Command
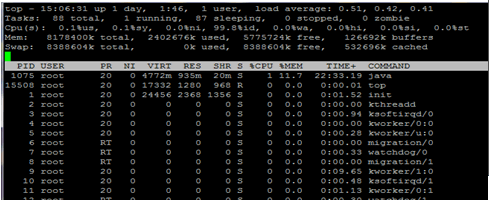
The "top" command displays the most CPU-intensive processes on the system and provides an ongoing look at processor activity in real-time.
The command displays system summary information as well as the processes currently being managed by the Linux kernel. The display continuously refreshes, providing valuable insight into the processes that are consuming the most resources and the ability to quickly monitor incremental usage of specific processes that can be slowly consuming resources over time. The output contains useful information such as CPU, Memory, Process Time, and Process ID.
Refer to Linux operating system documentation for more information about the "top" command.
Linux "top" Command Display
Linux "vmstat" Command
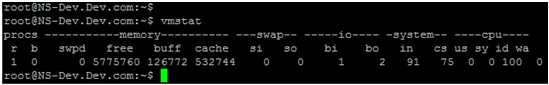
The Linux "vmstat" (virtual memory statistics) command displays summary information about operating system memory, processes, interrupts, paging and block I/O. The first report displayed provides the averages since the last reboot.
If you want to use the command to monitor the virtual memory activity on your system, it is best to specify a sampling interval. Executing the command at predefined intervals helps to identify the rate of change in specific values. The command "vmstat -an 10 15" executes with a display that runs every 10 seconds for 15 iterations, and includes active and inactive memory usage.
Of particular interest would be whether the system is using swap memory, and if so, how frequently and what are the overall memory conditions when this occurs. Keep in mind that it is normal for Linux-based systems to have higher memory consumption due to the operation of the OS, but further investigation is warranted when swap memory is being used.
Refer to Linux operating system documentation for more information about the "vmstat" command.
Linux "vmstat" Command Display
ExtremeCloud IQ Site Engine Server Disk Utilization
Unmanaged log data or backup files can quickly consume disk space, creating a disk space problem on the ExtremeCloud IQ Site Engine server. Disk space issues can cause problems such as an upgrade that fails to execute due to inadequate disk space or, more seriously, an ExtremeCloud IQ Site Engine server crash.
Here are three tools you can use to troubleshoot disk usage problems on the ExtremeCloud IQ Site Engine server.
Linux "vmstat -D" and "vmstat -d" Commands
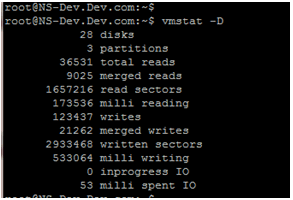
The "vmstat" (virtual memory statistics) command with the "-D" or "-d" option displays disk read and write activity. The "-D" option provides a summary of total disk activity for the entire system, while the "-d" option displays individual disk activity statistics for each disk on the system.
These commands are useful when monitored disk activity (see Monitor ExtremeCloud IQ Site Engine Server Disk Access) indicates an abnormal change that corresponds with performance-related issues on the ExtremeCloud IQ Site Engine server. The disk statistics provide a real-time view into disk activity that can perhaps be tied to specific actions.
Refer to Linux operating system documentation for more information about the "vmstat" command.
Linux "vmstat -D" Command Display
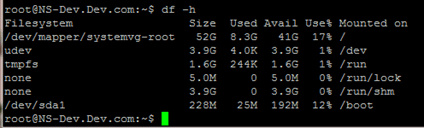
Linux "df" and "du" Commands
The Linux "df" command displays how much free disk space is available on the file system. Use "df" to view the overall system disk utilization and identify whether certain directories are at or near full capacity. Use the "-h" option to display the statistics in human readable format.
The "du" command can be used to identify the size of specific files or directories within a parent directory. This command is useful when trying to narrow down specific areas of the file system that are consuming large amounts of disk space.
| NOTE: | Running the "du" command from a parent directory with the "-ha" option can return a large amount of data. Use the "|more" option or redirect to a file to view the total results for the command. |
Refer to Linux operating system documentation for more information about the "df" and "du" commands.
Linux "df -h" Command Display
ExtremeCloud IQ Site Engine Server Diagnostics
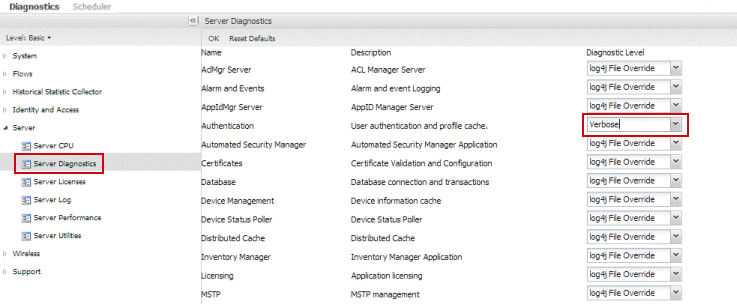
Use the Administration tab (Diagnostics sub-tab) to obtain detailed debug information for ExtremeCloud IQ Site Engine server processes and applications. Select from a list of diagnostic options to enable targeted debugging of specific system functions. This allows for the collection of relevant data and also helps to limit the overall impact to the system when debugging is enabled.
| CAUTION: | ExtremeCloud IQ Site Engine server diagnostics should only be enabled when a specific area of an issue has been identified, or under the guidance of Extreme Networks Support. Certain debug options generate verbose output and could cause adverse effects to the system if enabled for extended periods of time. Debug options should only be enabled long enough to capture data from the behavior under investigation. |
Access Server Diagnostics in ExtremeCloud IQ Site Engine by selecting the Administration tab and then expanding the Server section on the Diagnostics sub-tab. Enable the different diagnostic groups by setting the Diagnostic Level to "Verbose" for the applications and processes of interest. Debug diagnostic information is mainly saved to the active server.log file on the ExtremeCloud IQ Site Engine server.
Server Diagnostics
Accessing the Server Log File
The server log file records server activity such as start-up log data, unexpected behavior messaging, and server debug diagnostic log data when enabled. Review previous server log file output to determine when a specific issue started to occur or to uncover additional system issues that can contribute to a current problem.
The file is archived daily into the same directory and is generally named in the server.log.date format.
The server log file can be accessed from the ExtremeCloud IQ Site Engine Launch page by selecting the Administration tab and then the Server Log tab. You can also view the Server Log in the Server Information window, which can be launched from the Tools menu or toolbar in every ExtremeCloud IQ Site Engine application. The Server Log can also be accessed from the /usr/local/Extreme_Networks/NetSight/appdata/logs directory.
ExtremeCloud IQ Site Engine Certificates
ExtremeCloud IQ Site Engine uses server certificates to provide secure communication for application web pages and for internal communication between server components.
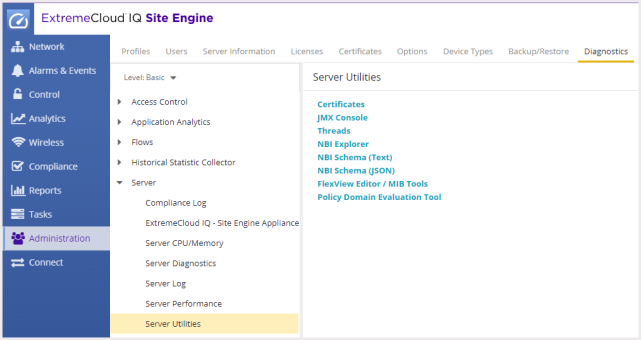
On the ExtremeCloud IQ Site Engine server, use the Server Utilities page to view ExtremeCloud IQ Site Engine server communication certificates. Access the page from the ExtremeCloud IQ Site Engine Launch page by selecting the Administration tab. Select on Server Utilities. You need to log in with your username and password. Select the Certificates link to open a new window that displays the Server Certificate Chain.
For more information on updating and configuring the ExtremeCloud IQ Site Engine server certificate, see the top-level Help topic ExtremeCloud IQ Site Engine and NAC Secure Communication and the How to Update the ExtremeCloud IQ Site Engine Server Certificate Help topic in the Server Information section of the Suite-Wide Tools User Guide.
Server Utilities
Generate a Show Support or Show Support Lite Report
Generate a Show Support or Show Support Lite report to provide to GTAC when requesting assistance with ExtremeCloud IQ Site Engine. These reports collect important statistical and diagnostic data.
Show Support
The Show Support report provides information pertaining to each of the applications within ExtremeCloud IQ Site Engine and creates a single archive that your support technician can review.
This data helps to answer many of the upfront questions typically asked when opening a support case, and also provides a comprehensive collection of key data that can reduce follow-up requests for more data and expedite a resolution to the issue.
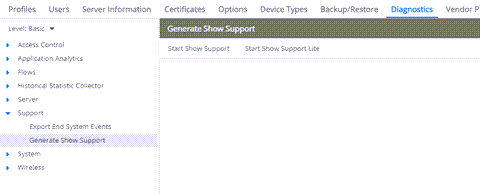
The Show Support report is generated from the Administration tab. Select the Diagnostics sub-tab and then expand the Support section. Select the Start Show Support button to start generating the report.
Show Support provides information about the following:
- Core Service
- Client log files from attached clients
- ExtremeCloud IQ Site Engine - ReportingServer
- Reporting diagnostic collections
- Collector Status
- Network Task Engine Details
- Vendor Profile Cache
- LoggerUtils Details
- Statistics
- Collector Config
- Device Usage Data csv file
- System Environment log file
- System Properties log file
- Rolling log file
- FlexView Details
- Domain details
- Database details
- Targets
- OneView Engine Details
- TopN Engine Details
- Host/Port Name Cache Details
- License Details
- SNMP Target Availability Summary
- SNMP Statistics Summary
- Search Details
- Target Type Counts
- Device Details Status
- Vendor Profile Details
deviceTypes/myDeviceTypes.properties - Vendor Profile Details
deviceTypes/MyVendorProfile.json - Flow Engine Details complete.
- Alarm/Event Details complete.
- Site Details complete.
- Console - ConsoleMBean
- Inventory Manager - InvServerManager
- Topology Manager - TopologyService
- Mediation Agent - MediationServer
- Application Analytics - AppIdMgrServer
- ExtremeCloud IQ Site Engine - MapServer
- Policy Manager - PolServerManager
- Policy Manager diagnostic data collection
- Domain statistics complete.
- NAC Manager - TrustedAccessMgrService
- ExtremeControl engines
- Wireless Manager - BkWirelessMgr
- BK Wireless Manager diagnostic data collection.
- BkManagementServer
- SSHConnectionPool
- ConfigurationManager
- DomainObjectCacheManager
- EventListeners
- ThreatObserverMgr
- ApObserverMgr
- MuObserverMgr
- RogueObserverMgr
- WlanServiceObserverMgr
- NSWMIntegration
- Langley
- BkSchedulerMBean
- TemplateMgrTestMBean
- ThirdParty log files
- ExtremeCloud IQ Site Engine - GovernanceServer
Upon completion, archived data is stored on the ExtremeCloud IQ Site Engine server in the <install directory>\appdata\ShowSupport folder in a single zipped archive that can be sent to update an open support case.
Show Support Lite
The Show Support Lite report provides information about a smaller set of ExtremeCloud IQ Site Engine features. Selecting this report creates a much smaller file that ExtremeCloud IQ Site Engine generates more quickly than the full Show Support report.
Use the Show Support Lite report when looking to gather initial diagnostic information or when instructed by GTAC.
The Show Support report is generated from the Administration tab. Select the Diagnostics sub-tab and then expand the Support section. Select the Start Show Support Lite button to start generating the report.
Show Support Lite provides information about the following:
- Core Service
- ReportingServer
- Reporting diagnostic collections
- Collector Status
- Network Task Engine Details
- Vendor Profile Cache
- LoggerUtils Details
- Statistics
- Collector Config
- Flow Engine Details
- Alarm/Event Details
- Site Details
- Console - ConsoleMBean
- Inventory Manager - InvServerManager
- Topology Manager - TopologyService
- Mediation Agent - MediationServer
- Application Analytics - AppIdMgrServer
- ExtremeCloud IQ Site Engine - MapServer
- Policy Manager - PolServerManager
- NAC Manager - TrustedAccessMgrService
- ExtremeControl Engines
- Wireless Manager - BkWirelessMgr
- ExtremeCloud IQ Site Engine - GovernanceServer
Upon completion, archived data is stored on the ExtremeCloud IQ Site Engine server in the <install directory>\appdata\ShowSupport folder in a single zipped archive that can be sent to update an open support case.