The Browser tab lets you query information about recent network activity stored in the ExtremeCloud IQ Site Engine database and display results in various grid and chart report formats. Using the Browser, you can create custom queries that provide greater flexibility in defining what data to display and how to display it. You can access the Browser from the ExtremeCloud IQ Site Engine Analytics tab.
Overview
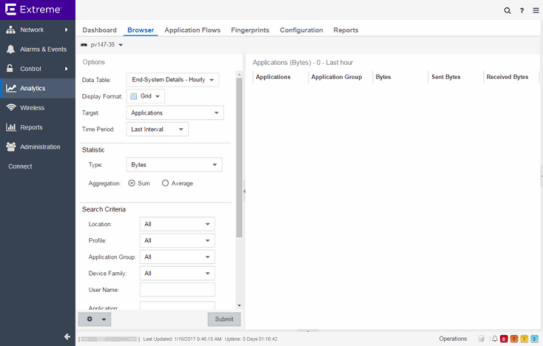
The Browser allows you to generate reports in several different formats using data based on selected options including a data target, statistic type, start time, and other search criteria.
For example, you can display application response time for the last hour or the last three days. You can view the results as a grid or a chart. You can filter the results to display data for a specific application or site.
If you have multiple ExtremeAnalytics engines, use the Engine drop-down list to select an engine to use as the source for the report data. Then, select the desired options on the left side of the Browser view and select Submit. The report is displayed on the right side of the view. Select an item in the report to view details or right-click an item to select from other focused reports.
After you have generated a report, use the Gear menu ( ) (at the bottom left of the options panel) to (
 ) save it to the Report Designer to use as a custom component, (
 ) bookmark the report, or (
 ) export it as a CSV file.
Data Aggregation
Network data displayed in a report is aggregated from your network by the ExtremeAnalytics engine and sent to ExtremeCloud IQ Site Engine. The data gathering process begins with the ExtremeAnalytics engine, which monitors network activity on the switch or controller you configure using a traffic mirror and NetFlow or application telemetry. The traffic mirror gathers the first (N) packets of a flow to determine the application in use, while NetFlow (a flow-based data collection protocol) provides information about the amount of data sent and received for the application. The engine holds this information in its cache and transmits the aggregated data to ExtremeCloud IQ Site Engine every five minutes to update the High-Rate data table information and every hour to update the hourly data table information. Creating a report in the Applications Browser displays the information sent from the ExtremeAnalytics engine to ExtremeCloud IQ Site Engine based on the criteria you select.
| NOTE: | Information held in the ExtremeAnalytics engine's cache is not saved. Restarting the ExtremeAnalytics engine before the data in the memory cache is sent to ExtremeCloud IQ Site Engine results in the loss of that information. |
Options
Following are definitions of the different options available when creating your custom query.
Data Table
Select which type of network activity data to query. The correct data table to use depends on the nature of the report.
- End-System Details - Hourly — End-system data collected every hour. Used when data for a specific client or server is needed, or when the information requested is highly specific, for example top applications used by Android devices in the London site.
- Application Data - Hourly — Application data collected every hour. Used for higher level information, such as top applications during an hour.
- Application Data - High-Rate — Application data collected at a higher rate (every five minutes). Used for a more detailed picture of how traffic changes over time.
- Application Telemetry - Hourly — Application Telemetry flow data collected every hour.
Display Format
Select the display format for the report: Grid, Chart Over Time, Word Cloud, Tree Map, or Bubble Map.
Target
Network traffic information is collected on objects in your network called targets. Some targets are physical, such as clients and servers, and some are logical, such as applications. Select the type of target that you want information about. Available targets vary depending on the selected data table. If you want information on a specific target, specify that target in the Search Criteria options.
- Applications — An application in ExtremeAnalytics is identified through layer 7 analysis of network traffic. For example, an application can be identified as Facebook.
- Application/Client — Information about applications used by clients, or about clients using an application.
- Application/Device Family — Information about applications used by device families, or about device families using an application.
- Application/Interface — Information about the applications used by interfaces.
- Application/Profile — Information about applications used by profiles, or about profiles using an application.
- Application/Server — Information about applications accessed on a particular server, or about severs using an application.
- Application Groups — Application categories, such as Cloud Computing or Social Networking, which are implied by the application.
- Device Family — The kind of device determined for a client, such as Windows or iOS. Device information is only available for some network traffic.
- Interface/Applications — Information about interfaces used by applications.
- Application-Interface Pair/Client — Displays the applications and interfaces used by clients.
- Interface/Client — Information about the interfaces used by clients.
- Sites — Sites are used by ExtremeAnalytics to identify the physical location for the client of an application flow. A site is a set of IP address ranges that identify a portion of your network. Multiple sites can be created to identify different buildings, sites, or geographical areas of your network.
- Profiles — A profile assigned to a client. Profile information is only collected under certain circumstances.
- Threat — Displays a list of the threat classifications that occurred during the Time Period you select.
- Threat/Threat End-System Pair — Displays a list of the threat classifications broken down by the IP addresses of the end-systems involved in the flow (the trusted and untrusted hosts) that occurred during the Time Period you select.
- Clients — The end-point of a flow which has the client role for that connection.
- Servers — The end-point of a flow which has the server role for that connection.
- Total — The total values for all detected traffic for the interval used by the data table (hourly or high-rate).
Statistic
Statistics are quantitative data that can be collected for the selected target. Available statistics vary depending on the selected target. Select the desired statistic for the report:
- Bytes — The number of bytes transferred in both directions, between the client and the server. Also known as bandwidth.
- Flows — The number of NetFlow records sent by the switch to report the traffic between the client and the server.
- Application Response Time — The average amount of time for a server to respond to a request.
- Network Response Time — The average amount of time to create a connection.
- Received Bytes — The number of bytes received by clients. This can be an estimated number of bytes if you are using an Application Telemetry flow.
- Sent Bytes — The number of bytes sent by clients. This can be an estimated number of bytes if you are using an Application Telemetry flow.
- Inbound Flows — The number of NetFlow records sent by the switch to report the server-to-client traffic. This is a rough indication of the duration of client connections.
- Outbound Flows — The number of NetFlow records sent by the switch to report the client-to-server traffic. This is a rough indication of the duration of client connections.
- Clients — The number of unique clients that have been seen associated with the target.
- Servers — The number of unique servers that have been seen associated with the target.
- Application Count — The number of unique applications seen for the selected target.
For byte, flow, and application count statistics, if you select a time range that is larger that the interval, specify whether you want the data aggregated as a summation of all the values for that statistic or as an average of all the values for that statistic.
Start Time
Select the start time (duration) for the report: Last Interval, Today, Yesterday, Last 24 Hours, Last 3 Days, or Last Week. You can also specify a custom start time and end time for the report. The Last Interval is the most recent recorded data covering a time period determined by the selected Data Table.
Search Criteria
Defining search criteria allows you to further filter the report data. Available criteria will vary depending on the selected data table and target. If you select either of the Application Data tables, you can only filter based on the selected target. For example, if you select Sites as your target, you can only filter on defined sites. If you select the End-System Details data table, you can filter on additional criteria. For example, if you select Sites as your target, you can filter on defined sites as well as flows for iOS devices.
You can enter a partial term in the text field or use the SQL wildcard "%" (as a substitute for multiple characters) or "_" (as a substitute for a single character) for multiple matches. For example, for the Device Family name, you could enter "iPhone %" to match iPhone 3, 4, and 5.
| NOTE: | Values entered in the text fields that contain multiple, non-alphanumeric characters can cause issues with the returned results. If this happens, alternate values should be used. |
- Site — Select a site to match or select World. If a site has been added to a map, you will also see a selection for that map. If you select custom, you can enter a partial site name or use the SQL wildcard characters to match one or more sites.
- Profile — Select an ExtremeControl profile to match or select All. If you select custom, you can enter a partial profile name or use the SQL wildcard characters to match one or more profiles. Profile information is only collected under certain circumstances.
- Application Group — Select an application group to match or select All. If you select custom, you can enter a partial application group name or use the SQL wildcard characters to match one or more groups.
- Device Family — Select the operating system family to match or select All. If you select custom, you can enter a partial device family name or use the SQL wildcard characters to match one or more families. Device information is only available for some network traffic.
- User Name — Enter a client's username to match. Username information is only available for some network traffic.
- Application — Enter an application name to match.
- Client — Enter a client's IP address or hostname to match.
- Engine — Select the ExtremeAnalytics engine for which you are generating the report.
- Limit — Select the number of results to return, for example, 10 clients.
Display Options
If you have selected Chart Over Time as your report display format, you can select whether to display the data as a line or an area, and also select the color to use in the chart.
Bookmark
After you have generated a report, select the Gear menu () in the lower left corner to save the
options you have currently set. A new window opens for the current
report with a link that can be bookmarked in your browser. You can then
use the bookmark whenever you want the same search
options.
Save to Report Designer
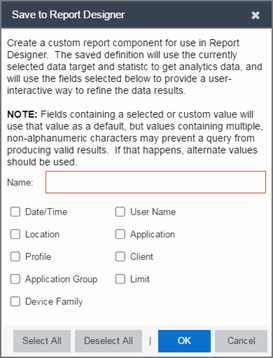
Select the Gear menu () in the lower left corner to access the Save to Report Designer window. This window lets you save the currently defined report to use as a custom component in the Report Designer. The custom component uses the target, statistic, and start time currently defined in the Browser.
Enter a name for the custom component and select any search criteria that you want displayed in the component panel. The search criteria is displayed as fields in the component panel, providing a custom interface that lets you further refine report data. If no search criteria are selected, the saved component only uses the target, statistic, and start time definitions when requesting data, creating a view-only report.
Export to CSV
Select the Gear menu () in the lower left corner and select ( ) to export the report data as a CSV file. The currently defined report opens in a spreadsheet, which can then be saved.
For information on related help topics: