The End-System Details window provides connection state and assessment information for a single end-system. It is launched from the End-Systems View in the Control tab, by double-clicking any end-system in the table or selecting an end-system and then selecting Show Details from the Tools menu.
The End-System Details window has four tabs. The Access Profile tab provides end-system summary information. The End-System tab provides end-system connection state information. The End-System Event tab displays end-system event information. The Health Results tab displays end-system assessment result information.
This Help topic provides information on the four tabs:
Access Profile Tab
The Access Profile tab presents a graphical view of end-system and health result information, providing an at-a-glance end-system summary. Select the information in each section to link to more detailed information.
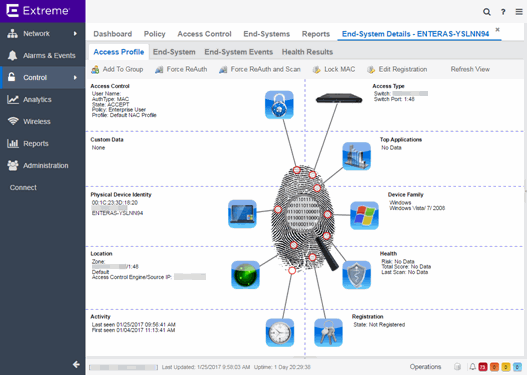
- Access Type
- Displays the switch IP address, port index, and port that the end-system is connected to. Select to open a PortView for the switch in a new tab.
- Top Application Flows
- Lists the top five applications and flow counts for the end-system, listed in descending order by flow count. Select to open the Applications Dashboard in a new tab.
- Device Family
- Displays the end-system's operating system (OS) family (for example: Windows, Linux, Android) and OS name. Use the device family icon to quickly determine the end-system type. Select to open the End-System tab where you can view additional end-system details.
- Health
- Displays health data from the latest scan, including risk level, total score, and last scan time. Use the health icon to quickly determine risk level by color. Select to open the Health Results tab where you can view additional health result information and details.
- Registration
- Displays the end-system's registration state, user name, and sponsor. Select to open the End-System tab where you can view additional registration information.
- Activity
- Displays the last seen and first seen times for the end-system. Select to open the End-System tab where you can view additional end-system details.
- Location
- Displays location summary information, including end-system zone membership, access point information, engine group, and engine IP address. Select to open the End-System tab where you can view additional location information.
- Physical Device Identity
- Displays the end-system's MAC address, IP address, and host name. The device icon displays the end-system's physical device type with a small OS-based icon in the corner. Select to open the End-System tab where you can view additional end-system details.
- Virtual Device Identity
- If the end-system is a virtual machine, this section displays virtual device information, including VM name, ID, Guest Name, and manufacturer. Use the icon to quickly determine the virtual machine's operating system. If the end-system is not a virtual machine, this section is replaced by Custom Data.
- Custom Data
- Displays any custom information associated with the end-system. Custom information for an end-system is added in the End-Systems tab or End-Systems View. If the end-system is a virtual machine, this section is replaced by Virtual Device Identity.
- Access Control
- Displays the end-system's user name, authentication type, connection state, policy, and profile. Select to open the End-System tab where you can view additional end-system authentication session details.
End-System Tab
This tab presents detailed information on the selected end-system's connection, authentication, and registration. Expand the sections using the arrow buttons to see additional information.
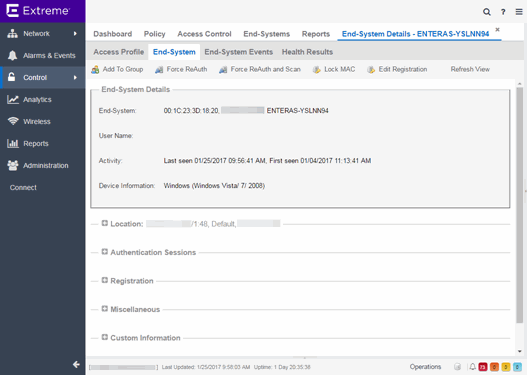
For a definition of various fields, see the column definitions included in the End-Systems topic.
Changes to group membership do not require an enforce and will be synchronized with engines immediately. Changes will not affect the end-system until the next authentication or assessment occurs.
End-System Events Tab
The End-System Events tab shows all the events for the selected end-system.
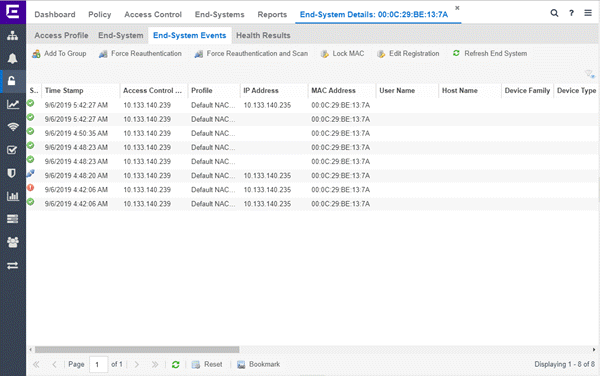
You can manipulate the table data in this window in several ways to customize the view for your own needs:
- Select the column headings to perform an ascending or descending sort on the column data.
- Hide or display different columns by selecting a column heading and selecting the column options from the menu.
- Rearrange columns by dragging a column heading to the desired position.
- Filter the data in each column in the table.
Health Results Tab
The top table in the Health Results tab provides summary information on scan results obtained for the selected end-system. The bottom table presents the individual health result details for the scan selected in the top table. Double-click any row in the bottom table to open the Health Result Details window and view a description, solution, and result for the health result. Information is displayed in this tab only if assessment is enabled on the network and there are health results in the database.
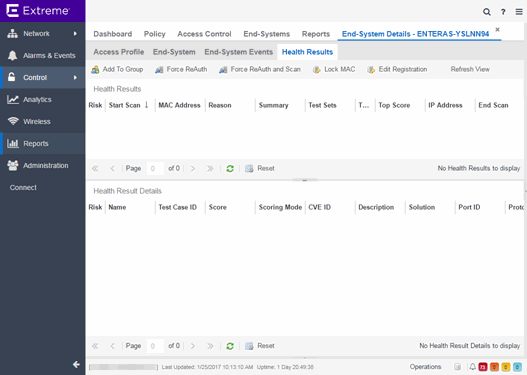
Health Results
This table presents health results for all the scans performed on the end-system.
- Risk
- The overall risk level assigned to the end-system based on the health result of
the scan:
- Red - High Risk
- Orange - Medium Risk
- Yellow - Low Risk
- Green - No Risk
- Gray - Unknown
- Reason
- The reason the health result was placed into the specified risk level. This is based on the risk level configuration that was used for the assessment, for example, if there was one or more health result detail with a score greater than 7. If the end-system is NAP capable, then this is based on the values returned from NAP.
- Summary
- A list of all the test cases that were run against the device during assessment. The test case name will be listed, or if that is not available, the test case ID will be listed.
- Test Sets
- The list of test sets that were run during assessment, for example, Default Nessus, Default Agent-less, and Default Agent-based. Test sets are defined as part of the assessment configuration. If the end-system is NAP capable, then this column displays Microsoft NAP indicating that NAP performed the assessment.
- Total Score
- The total sum of the scores for all the health details that were included as part of the quarantine decision, followed by the actual score in parenthesis. The actual score is what the total score would be if all the health details were included as part of the quarantine decision. It includes all scores, including those marked Informational and Warning. If the total score and the actual score are the same, only one score is shown.
- Top Score
- The highest score received for a health detail that was included as part of the quarantine decision. Scores that are marked as Informational or Warning are not considered.
- Server Name
- The name of the assessment server. For on-board assessment servers, the name is determined by the name of the ExtremeControl engine. For example, if you create an ExtremeControl engine and name it MyAccessControlengine, then the on-board assessment server name will be listed as MyAccessControlengine as well.
- Server IP
- The IP address of the assessment server. For on-board assessment servers, the IP address is determined by the address of the ExtremeControl engine. For example, if you create an ExtremeControl engine with an IP address of 10.20.80.8, then the on-board assessment server IP address is listed as 10.20.80.8 as well.
- Server Port
- The port number on the assessment server to which the ExtremeControl engine sends assessment requests.
- Host Unreachable
- Displays whether the end-system was unreachable and could not be scanned: Yes or No.
Health Result Details
This table displays the individual health result details for the scan selected in the top table. Double-click any health result detail to open the Health Result Details window that displays a description, solution, and result for the health result.
- Risk
- The risk level assigned to the problem found on the port:
- Red - High (corresponds to a Hole)
- Orange - Medium (corresponds to a Warning)
- Yellow - Low (corresponds to a Note)
- Black - No Result Available
- Score
- The score assigned to the test case. The score is a value between 0.0 and 10.0. In the case of agent-based test cases, the score will be either 0.0 for a passed test, or 10.0 for a failed test, unless specifically overwritten by the scoring override configuration.
- Scoring Mode
- The scoring mode that was used at the time the test was performed.
- Applied - The score returned by this test was included as part of the quarantine decision.
- Informational - The score returned by this test was reported, but did not apply toward a quarantine decision.
- Warning - The score returned by this test was only used to provide end user assessment warnings via the Notification portal web page.
- CVE ID
- The CVE (Common Vulnerability and Exposures) ID assigned to the security vulnerability or exposure. For more information on CVE IDs, refer to the following URL: https:/cve.mitre.org/.
- Remediation Success
- For agent-based assessment, this column lists the results of remediation attempts: Remediation Successful, Remediation Failed, or Not Applicable.
- Type
- A "type" is assigned to each security risk found on a port
during an assessment, and is used to determine whether to Quarantine an end-system.
Types are configurable on the assessment agent.
There are three types:
- Hole - The port is vulnerable to attack.
- Warning - The port may be vulnerable to attack.
- Note - There may be a security risk on the port.
Buttons and Paging Toolbar
- Add to Group
- Lets you add the selected end-system to a specific end-system or user group. After adding an end-system to a group, any rules that have been created that involved that group will now apply to the end-system as well. Changes to end-system group membership do not require an enforce and will be synchronized with engines immediately. Changes will not affect the end-system until the next authentication or assessment occurs.
- Lock MAC
- Opens the Add MAC Lock window where you can lock the MAC address of the selected end-system to a switch or switch and port.
- Edit Registration
- Opens a window where you can edit the expiration time and maximum registered device count for the end user.
- Refresh
- Use the refresh button to update the data in the table.
- Paging Toolbar
- The paging
toolbar provides four buttons that let you easily page through the table: first, previous, next, and last page.
- Reset
- The reset button clears the search field and search results, clears all filters, and refreshes the table.
- Bookmark
- Use the bookmark button to save the search, sort, and filtering options you have currently set.
For information on related help topics:
![]()