The Event Analyzer tab provides information about events caused by wireless end-points connecting to your network.
You can access the tab in a number of ways and the information presented changes depending on the method you use:
- Navigating via Wireless > Clients > Event Analyzer shows all end-points.
- Selecting a Location on the Wireless > Clients tab opens the Event Analyzer for the end-points that occurred for all APs in that Location.
- Selecting a MAC address on the Wireless > Clients tab opens the Event Analyzer for only that end-point.
When accessing the tab using the top two methods, a Clients section is available in the left-panel. This section provides you with the ability to display end-point events for specific AP locations.
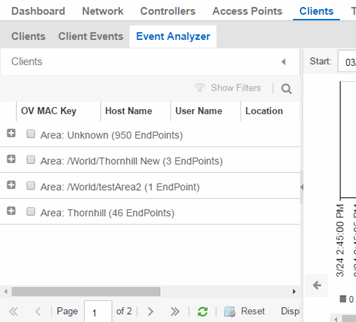
Once you select the appropriate end-points or areas, this section can be collapsed by selecting the left arrow.
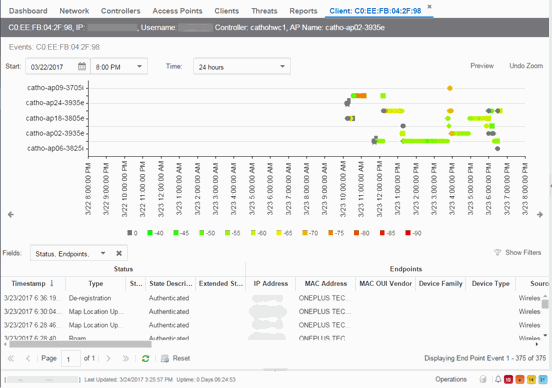
The top of the tab contains a graph displaying the RSS (Received Signal Strength) for the end-point events.
The bottom contains a table showing information about each event.
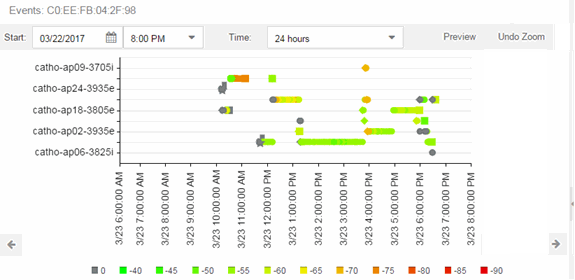
RSS Graph
The RSS graph at the top of the tab shows the signal strength (in dBm) between the end-point and each of the APs to which it connected. The shape of the end-point event indicators in the graph indicate the type of event.
Events Table
The Events table at the bottom of the tab contains details about the end-point events for your network, or for the wireless location or MAC address you selected.
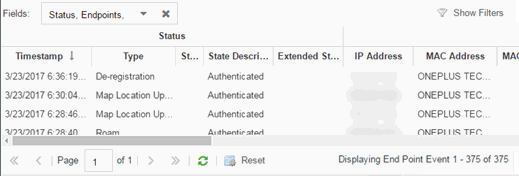
Use the Fields drop-down list to select groups of columns to display in the table:
- Select Status to display the following columns in the table:
- Date/Time
- Type
- State
- State Description
- Extended State
- Select Endpoints to display the following columns in the table:
- IP Address
- OV MAC Key
- MAC Address
- MAC OUI Vendor
- Host Name
- Device Family
- Device Type
- Source
- Select User Access to display the following columns in the table:
- User Name
- Policy
- Authorization
- Profile
- Reason
- Auth Type
- Registration Type
- RADIUS Server IP
- Select Location to display the following columns in the table:
- Switch Port
- Switch Port Index
- Switch Location
- AP Name
- AP Serial #
- BSSID
- SSID
- Protocol
- Location Type
- Location
- Location Details
- Area Type
- Area
- ExtremeControl Engine/Source IP
- Select Metrics to display the following columns in the table:
- RSS
- SNR
- Select Threat/Risk to display the following columns in the table:
- Categories
- Start Time
- Select Network Service to display the following columns in the table:
- Switch IP
- Controller IP
For information on related help topics:
For information on related ExtremeCloud IQ Site Engine topics:
![]()