The Wireless tab in ExtremeCloud IQ Site Engine provides dashboards, Top N information, and detailed charts to help you monitor the overall status of your wireless network. Reports are flexible and interactive, allowing you to configure time ranges and data rollup values to use for each report. Use the report Search and Filter capabilities to narrow down the data shown in the report tables. Select links in the reports to quickly drill down to more detailed information.
The Menu icon (![]() ) at the top of the screen provides links to additional information about your version of ExtremeCloud IQ Site Engine.
) at the top of the screen provides links to additional information about your version of ExtremeCloud IQ Site Engine.
To view wireless reporting data, you must enable statistics collection for your wireless controller devices from either Network tab (or the legacy Console application in the device tree or Device Properties tab). On the Network tab, right-click a wireless controller and select Device > Collect Device Statistics. In the Console device tree or Device Properties tab, right-click the controller and select the OneView > Collect Device Statistics checkbox. When you enable Wireless Controller statistics collection (which includes Wireless Controller, WLAN, Topology, and AP wired and wireless statistics), you also have the option to collect wireless client statistics. ExtremeCloud IQ Site Engine begins collecting data on the controller device it uses in its Wireless reports.
To view all Wireless reports, you must be a member of an authorization group that has been assigned full read access capabilities to all of the ExtremeCloud IQ Site Engine tabs and reports.
This Help topic provides information on each Wireless report, plus a section on helpful report features and functionality.
Dashboard
The Dashboard menu in the upper left corner provides access to the Dashboard report and the Overview report, as well as additional Top N and summary reports on your wireless devices and clients.
Overview Report
The Overview displays a selection of reports
that provide highly summarized information about your wireless network. Select the Gear button ( ) to open additional fields from which you can configure the information presented in the reports.
Select links to drill down for more information. Use the drop-down menus to select the date, time, and whether to display Daily, Hourly, or Raw Data.
Wireless Network Summary Report
The Wireless Network Summary dashboard displays three reports displaying the wireless client information, wireless and wired bandwidth usage, and the number of active APs in your network.
Use the drop-down menus to select the time displayed and whether to display Daily, Hourly, or Raw Data.
Network
The Network tab presents a top-level wireless network summary report along with additional reports on wireless mobility zones, virtual networks, controllers, and AP groups. These context sensitive reports include data-point rollovers and drill-down links to additional detailed reports, as well as the ability to launch local management.
Reports are presented in a familiar wireless component tree structure similar to how components are displayed in Wireless Manager. Selecting any node in the tree provides contextual information for that node.
Select Discover All Controllers in the Tools menu at the bottom of the tree panel to perform a discover operation that looks for any configuration changes on your wireless controllers with device statistics collection enabled. In addition, you can select Discover Controller to rediscover a single controller. Select the controller in the tree, select the down arrow next to the Discover button and select Discover Controller.
Select Manage Controllers in the menu at the bottom of the tree panel to open the ExtremeWireless Assistant where you can remotely manage your wireless controllers.
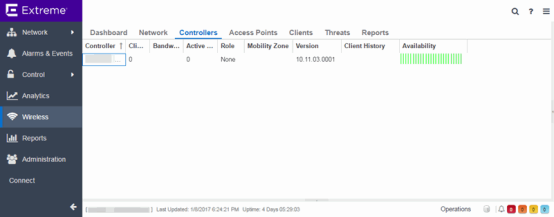
Controllers
This report displays summary information for each controller. Select the Controller IP address link to open a report that shows APs by channel, clients by protocol, clients by WLAN, clients, and bandwidth usage information for just that controller.
Access Points
This report displays summary information for all the Access Points on your wireless network. Hover over the far left column and select the gray arrow ![]() to open the AP Details window that provides controller, bandwidth, and client information. Select a single AP name link to open an in-depth AP Summary view for the selected AP.
to open the AP Details window that provides controller, bandwidth, and client information. Select a single AP name link to open an in-depth AP Summary view for the selected AP.
Select an AP Status icon to open a table listing the current alarms for the AP. Right-click on a single AP to access a menu of AP reports. Right-click on an AP and select Search Maps to open a map with the AP in the center.
Select one or more APs and use the Menu icon( )
in the upper left corner (or right-click on a row) to access various reports and perform various AP actions including:
)
in the upper left corner (or right-click on a row) to access various reports and perform various AP actions including:
- Refreshing/rediscovering the selected APs
- Editing AP location
- Setting AP orientation
- Adding selected APs to a specified ExtremeCloud IQ Site Engine map or to maps based on AP location
- Removing selected APs from associated maps
- Searching maps for the selected APs
Additionally, there are two methods of exporting the data in the table:
- Export to CSV
- Select to export all of the data in the table to a .CSV file. The exported data displays with any sorting, filtering, and searching applied.
- Export Selected to CSV
- Select to export the data in the currently selected row(s) in the table to a .CSV file. The exported data includes all columns in the table (including those not currently displayed).
Clients
The Clients report provides information on wireless network clients and client events. The Clients sub-tab displays a list of the currently active clients on the wireless network. The Client Events tab shows a historical list of the add, delete, and update events for clients on the wireless network. Events are triggered by:
- Client session start and end
- Inter-AP roaming
- IP address change (including going from no IP address to having one)
- Authentication state change
Events must be collected to display event data in the Clients tab. To enable event collection, select the Enable Event Collection button at the bottom of the tab.
Select a client or client event in the report tables and use the Menu icon ()
in the upper left corner to access additional reports:
- Client History — Opens a report displaying bandwidth, RSS, and packet statistics for the selected client. (You can also access the Client History report by selecting a client's MAC address in the table.) From the Client History window, you can select a button to launch PortView for that client.
- Client PortView — Launches a PortView for the client.
- Search Maps — If the client is connected to a switch added to an ExtremeCloud IQ Site Engine map, the Maps sub-tab opens with the client centered on the map.
- AP Summary — Opens a report displaying summary statistics for the client's AP. From the AP Summary window, you can select a button to launch a Wireless AP Radio Summary report and also launch PortView for the AP device. (You can also access the AP Summary report by selecting the AP Name link in the Client Events table.)
Use the Search field to search the reports by specifying an active user name or host name, MAC address, active IP address, or AP name.
Additionally, there are two methods of exporting the data in the table:
- Export to CSV
- Select to export all of the data in the table to a .CSV file. The exported data displays with any sorting, filtering, and searching applied.
- Export Selected to CSV
- Select to export the data in the currently selected row(s) in the table to a .CSV file. This includes all of the columns in the table.
Client Events Report Options
You can set data collection options for the Client Events report in the Wireless History Settings window accessed from Console OneView Collector options (Tools > Options > Console > OneView Collector > Wireless Collection > Edit Client History and Threat options). These options include setting the maximum number of client changes to store in the history and the maximum number of client events the report can request at one time.
You can also filter client events to include or exclude certain SSIDs using the Console OneView Collector options (Tools > Options > Console > OneView Collector > Wireless Collection > Edit Include/Exclude Filter List). This allows you to filter the history so only events for clients you are particularly interested in are displayed.
Client Location Information
Mouse over the Location column in the report tables to view a tooltip that displays whether the client's location is based on triangulated (Triangulation) or Cell of Origin data. The tooltip also displays whether the client's location is currently being tracked by the controller and if it is on the controller's on-demand list.
To track clients, enable the "Locate Active Sessions" setting in the wireless controller's Location Engine Settings. When this setting is enabled, the controller's location engine automatically tracks the location of all associated clients up to the platform's limit (e.g. 2500 stations for C5210). Even if a client has a session on a controller, if the limit has been reached, the location engine may not be tracking that particular client. Use this tooltip to determine if the client is currently being tracked.
Clients added to the controller's on-demand list are always tracked, regardless of whether tracking is enabled and any platform limits. Place clients that require guaranteed location history on the controller's on-demand list, configured in the controller's Location Engine Settings. Clients on this list also receive better location detection than other tracked clients, minimizing the number of Cell of Origin location results.
For more information on configuring controller Location Engine Settings and on-demand lists, refer to the Extreme Networks Convergence Software User Guide. Refer to the section on "Configuring the Location Engine" in the Working with ExtremeWireless Radar chapter.
Event Analyzer
The Event Analyzer tab provides information about wireless end-points connecting to your network.
Threats (Legacy)
| NOTE: |
Threats reports provide data only if a compatible Extreme Wireless Controller (EWC) is present. The ExtremeCloud IQ Controller is not compatible with this feature. |
These reports show devices detected by the Radar WIDS-WIPS system as sources of threats or interference on the wireless network.
A threat source is a device detected to be performing one or more types of attacks on the wireless network.
An interference source is a device generating a radio signal interfering with the operation of the wireless network. An example of an interference source is a microwave oven, which can interfere with 2.4GHz transmissions.
There are four sub-tabs displaying active and historic data:
- Threats — Lists only currently active threats.
- Threat Events — Lists a historic record of threat events including active threats.
- Interference — Lists only currently active sources of interference.
- Interference Events — Lists a historic record of interference events including active sources of interference.
| NOTE: |
You can set the maximum number of threat events to store in history in Console (Tools > Options > Console > OneView Collector > Wireless Collection > Edit Client History and Threat options). |
Following are definitions of the table columns and fields displayed in the sub-tabs.
Status
The status of the threat or source of interference.
- Active — An active threat or source of interference on the network.
- Inactive — A threat or source of interference no longer active on the network.
- Aged — A threat or source of interference not reported by Radar as having gone away and has not been seen for more than an hour.
Type
The type of threat or interference detected. Threats with no type display their category.
Categories
Individual threat types are grouped into the following categories:
- Ad Hoc Device — A device in ad hoc mode can participate in direct device-to-device wireless networks. Devices in ad hoc mode are a security threat because they are prone to leaking information stored on file system shares and bridging to the authorized network.
- Cracking — This refers to attempts to crack a password or network passphrase (such as a WPA-PSK). The Chop-Chop attack on WPA-PSK and WEP is an example of an active password cracking attack.
- Denial of Service (DoS) attacks
- External Honeypot — An AP attempting to make itself a man-in-the-middle by advertising a popular SSID, such as an SSID advertised by a coffee shop or an airport.
- Internal Honeypot — An AP attempting to make itself a man-in-the-middle by advertising an SSID belonging to the authorized network.
- Performance — Performance issues pertain to overload conditions that cause a service impact. Performance issues aren't necessarily security issues, but many types of attacks do generate performance issues.
- Prohibited Device — A MAC address or BSSID is detected that matches an address entered manually into the Radar database.
- Spoofed AP — An AP not part of the authorized network is advertising a BSSID (MAC address) that belongs to an authorized AP on the authorized network.
- Client Spoof — A device using the MAC address of another typically authorized station.
- Surveillance — A device or application probing for information about the presence and services offered by a network.
- Chaff — An attack that overloads a WIDS-WIPS causing it to miss more serious attacks or to go out of service. FakeAP is an example of a chaff attack.
- Unauth Bridge — A device that forwards packets between networks without authorization to do so.
- Injection — The attacker inserts packets into the communication between two devices so the devices believe the packet is coming from an authorized device.
MAC Address
The MAC address to which this threat event applies. In the case of Spoofed AP, Internal Honeypot, or External Honeypot, it is the advertised BSSID of the threat AP.
Start Time
The date and time the threat or source of interference is identified.
Stop Time
The date and time the threat or source of interference stopped.
Countermeasures Applied
Countermeasures the AP is taking against the threat. These include:
- Prevent authorized stations from roaming to external honeypot APs.
- Prevent any station from using an internal honeypot AP.
- Prevent authorized stations from roaming to friendly APs.
- Prevent any station from using a spoofed AP.
- Drop frames in a controlled fashion during a flood attack.
- Remove network access from clients in ad hoc mode.
- Remove network access from clients originating DoS attacks.
- None
AP Name
Name of the AP reporting the threat or source of interference. Select the link to open the AP Details window that provides controller, bandwidth, and client information.
From the AP History sub-tab, select the Gear menu
 in the upper right corner of the window to access a menu of additional AP reports.
RSS
Receive signal strength (in dBm) of the threat or source of interference.
Additional Details
Additional information including:
- frequency=<channel> or NA
- SSID=<SSID name>
- encryption=<WEP/WPA1/WPA2/WPA12>
Search
Use the Search field at the top right of the window to search by threat type, threat category, MAC address, or AP name.
Refresh Interval
Use the Refresh drop-down list at the top right of the window to specify an interval (in seconds) at which the threat or interference data is automatically refreshed. To stop auto refresh, select the Refresh Off option.
Search Maps
To locate an AP on a map, right-click on a threat and select Search Maps. If the AP is added to a map, the map opens with the AP centered on the map.
Reports
The Reports tab allows you to view information about the APs, controllers, and wireless traffic on your network. Available reports are accessible via the Reports drop-down list at the top of the tab.
Select the Export to CSV button ( ) to export the information contained in the report to your default CSV application, where it can then be manipulated or saved.
Report Features
ExtremeCloud IQ Site Engine reports include the following features (depending on the report selected):
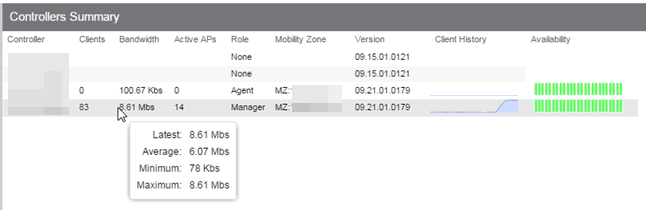
- Drill-down for Details — Link to summary reports containing more detailed information.
For example, in the Controller Summary report, selecting a controller shows a
detailed report for that controller over time.
- Interactive Tables — Manipulate table data
in several ways to customize the view for your own needs:
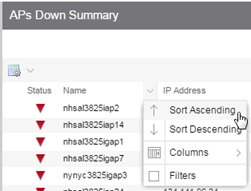
- Select the column headings to perform an ascending or descending sort on the column data.
- Hide or display different columns by selecting a column heading drop-down arrow and selecting the column options from the menu.
- Filter, sort, and search the data
in each column
in the table.
- Interactive Charts — Use data-point rollovers for quick information on chart data. For example, in the Controller Summary report, rolling over the value reported
for Bandwidth provides additional bandwidth statistics over time.
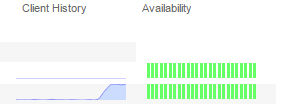
- Sparkline Charts — View network trends in dense, succinct charts that present
report data in an easy to read, condensed format. This provides you with a quick way to catch
possible problem areas that you can investigate further. Rollover charts for additional
information.
For information on related help topics:
For information on related ExtremeCloud IQ Site Engine topics:
![]()