Use the Alarms & Events tab to display alarm and event details for all managed devices in the network, with sorting and filtering of relevant information for network troubleshooting and forensics.
Additionally, the Menu icon (![]() ) at the top of the screen provides links to additional information about your version of ExtremeCloud IQ Site Engine.
) at the top of the screen provides links to additional information about your version of ExtremeCloud IQ Site Engine.
This Help topic provides information on the following topics:
- Access Requirements
- Alarms
- Alarm Configuration
- Events
- Event Configuration
- Buttons, Search Field, and Paging Toolbar
Access Requirements
To view the information in the Alarms and Event logs, you must be a member of an authorization group assigned the appropriate ExtremeCloud IQ Site Engine capabilities:
- XIQ-SE OneView > Access OneView
- XIQ-SE OneView > Events and Alarms > OneView Event Log Access
- XIQ-SE OneView > Events and Alarms > OneView Alarms Read Access or Read/Write Access
For additional information, see Users and Access Requirements.
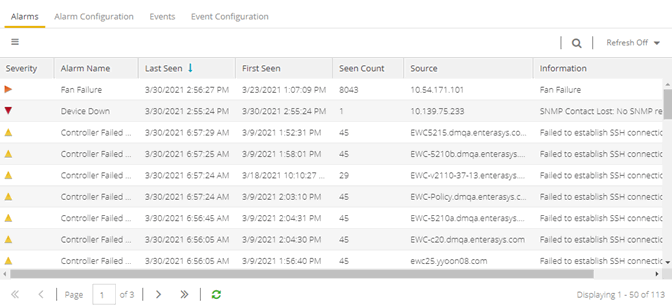
Alarms
Use the Alarms & Events tab to access the Alarms tab that displays the current alarms for the network.
In the Alarms tab, right-click on the alarm or select the Menu icon ( ) to display several additional functions:
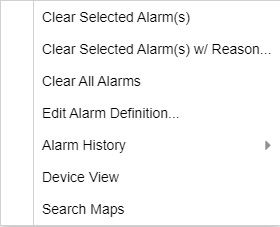
- Clear Selected Alarm(s) w/ Reason
- Select to clear the selected alarm or alarms. Supply a reason the alarm(s) cleared, if necessary. which is recorded in the Alarm History.
- Edit Alarm Definition
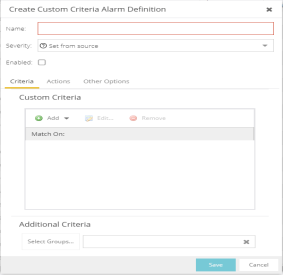
- Select to open the alarm in the Alarm Configuration window, from which you can edit the criteria which triggers the alarm. The Create Custom Criteria Alarm Definition window opens:
-
The severity of the alarm displays in the Severity field. Use the drop-down list to change the alarm severity. The Enabled check box indicates if the custom criteria has been enabled. -
- Select the Criteria tab to open the Custom Criteria window, where you can Add, Edit or Remove specific criteria details the alarm.
Use the Additional Criteria field to add new criteria. Select the Select Groups button to open the Alarm Group Section window. - Select the Actions tab to Add, Edit, Remove actions to the alarm definition. Select the Add button to open the Action drop-down list:
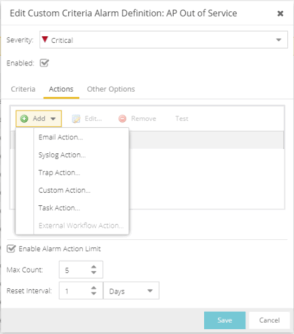
The following actions are included on the drop-down list. Select the Override Content check box to change the message content of the action.- Email Action - Sends an email to email addresses you select
- Syslog Action - Sends a syslog message
- Trap Action - Sends a trap to a remote Trap Receiver. The type of trap being sent to the remote server is determined by the SNMP Credential profile selected. If the profile is V2c or V3 and the ‘Use SNMP Informs’ is selected, then SNMP informs will be sent instead of SNMP traps.
NOTE: When using SNMPv3 Traps, the Trap Receiver needs to have a v3 user created with the SNMPv3 Trap Server Engine ID to receive the traps. - Custom Action - Select to add a customized action.
- Task Action - Select to add actions to Workflow tasks.
- External Workflow Action- Select to add actions to a user workflow,
- Select the Other Options tab to clear the conditions of actions for alarms you select.
- Select the Criteria tab to open the Custom Criteria window, where you can Add, Edit or Remove specific criteria details the alarm.
- Alarm History
-
Right-click on the alarm or select the Menu icon () and select Alarm History > All to view the Alarm History for all devices.
- Right-click on the alarm or select the Menu icon () and select Alarm History > By Source to view an Alarm History for that device. If the Source includes a subcomponent (such as an interface on the device), then the alarm history is specific to that subcomponent.
- Right-click on the alarm column or select the Menu icon () and select Alarm History > By Alarm Name (Devices with Reference Firmware Impact) to view an Alarm History for a specific alarm.
- Device View
- Allows you to specify contact information for the person maintaining the device. Additionally, enter a backslash "/" between contacts to create a device group in a tiered tree structure. For example, to move the device into a device group called "John's Devices" within a device group called "Quality Assurance Testing", enter Quality Assurance Testing/John's Devices in this field.
- Search Maps
- Allows you to specify contact information for the person maintaining the device. Additionally, enter a backslash "/" between contacts to create a device group in a tiered tree structure. For example, to move the device into a device group called "John's Devices" within a device group called "Quality Assurance Testing", enter Quality Assurance Testing/John's Devices in this field.
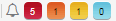
Alarm Summary
Every ExtremeCloud IQ Site Engine page includes a system-wide Alarm Summary in the lower right corner. This indicates the number of current alarms for each severity (Critical, Error, Warning, and Info) present in the entire system. If there are no current alarms, the status displays all zeroes. Select an indicator to open the Alarms tab filtered to display the alarms of that severity. An alarm with a slash indicates the alarm is disabled.
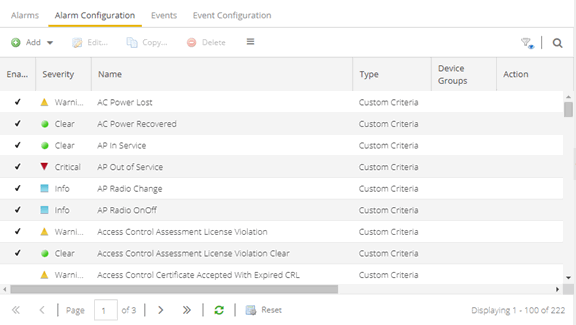
Alarm Configuration
Use the Alarm Configuration tab in the Alarms & Events tab to configure the network alarms that provide status information for a particular problem or condition on a particular network component. Alarms are triggered when event conditions (called a trigger event) occur on your network, and they are tracked until the problem or condition is removed. From the Alarm Configuration tab you can also create an alarm definition that detects when the problem or condition is removed and clears the alarm. For example, a Link Down alarm is triggered when a device emits a linkDown trap. Then, when the device emits a linkUp trap, the Link Up alarm automatically clears the Link Down alarm.
Via the Add menu, you can:
- Add a new alarm definition, which includes configuring the conditions (criteria) that trigger the alarm, and defining the actions that occur automatically to notify a person or network component about the problem, when the alarm triggers.
- Edit and delete alarm definitions as well as configure email settings for alerts.
ExtremeCloud IQ Site Engine ships with a set of default alarm definitions, which you can use as is, or delete or modify them as desired. Additionally, you can create your own.
Alarm Configuration Column Definitions
Enabled — A check mark in the Enabled column indicates the alarm definition is active. Ignore an alarm definition to ignore your enabled alarms without deleting the definition.
Severity — The icons indicate the seriousness of an alarm definition. This column displays its own specified severity, regardless of the severity of the event or trap that triggered it.
-
 (question mark) Set from Source — the alarm definition uses the severity level of the trigger event, for example a warning event.
 -
 (Red) Critical — A problem with significant implications.
 -
 (Orange) Error — A problem with limited implications.
 -
 (Yellow) Warning — A condition that might lead to a problem.
 -
 (Blue) Info — Information only; not a problem.
 -
 (Green) Clear — An alarm that clears another alarm (for example, LinkUp).
Name — The name of the alarm definition.
Type — Identifies the type of alarm definition for this row (threshold, trap, or custom criteria).
Device Groups — If desired, you can restrict the alarm definition to devices and port elements in one or more device groups. This column indicates the device group to which the alarm definition is assigned. The alarm definition is only raised on the devices and interfaces in the selected device groups. This allows you to filter alarms to specific devices or important ports.
Action — The actions that occur when an alert is triggered, if any.
Limit Enabled — A checkbox indicates that there is a rate-limit on the alarm's actions.
Max Count — If Limit Enabled is checked, this column indicates the number of times an action is performed for this alarm. When the limit is reached, the alarm is still recorded, but no further actions are performed until the Reset Interval expires. If you configure multiple action types, the limit is for the number of times the set of configured actions is performed, not for each individual action. If Limit Enabled is not checked, there is no limit placed on the number of times the action is performed.
Reset Interval — If Limit Enabled is checked, this column displays the length of time from when the first action is triggered until the count is reset. When the count is reset, actions are executed until the Max Count is reached again. If the reset interval is set to "None", then when the alarm limit is reached, the alarm does not reset unless manually reset.
Clearing Alarms — This column displays the Name of the alarm that acts to clear the current alarm.
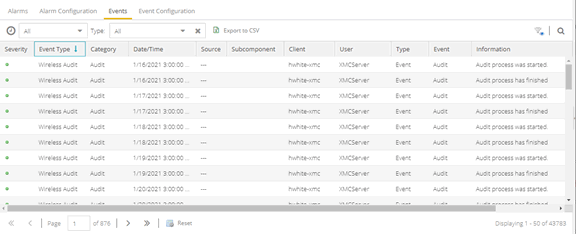
Events
Use the Events tab in the Alarms & Events tab to access the event log, as well as the event logs for ExtremeCloud IQ Site Engine, legacy applications, and ExtremeControl Audit events and Wireless Audit events. In addition, you can access an event log for ExtremeCloud IQ Site Engine Scheduler events.
Use the drop-down list at the top of the table to filter events based on application:
- Selecting Console displays event logs with an Event Type of Admin, Console, and Wireless. Selecting Console View displays event logs with an Event Type of Console only.
NOTE: Selecting both Console and Console View displays the event logs with an Event Type of Console twice. - The ExtremeCloud IQ Site Engine event logs for ExtremeCloud IQ Site Engine and components (Console, Inventory, Policy, NAC Manager, and Wireless) present the same data as the event logs in the actual applications.
- The ExtremeControl Audit event log provides information on ExtremeControl Registration events such as when a device or user is added during the registration process, or an end-system is added/removed/updated via the registration administration web page.
- The ExtremeControl Engine event log displays engine events.
| NOTE: | Installed certificates using an MD5 RSA signature algorithm now generate an event in ExtremeCloud IQ Site Engine version 7. |
|---|
The Wireless Audit event log allows you to view the configuration activity on Wireless Manager.
The ExtremeAnalytics event log displays ExtremeAnalytics engine events as well and ExtremeAnalytics configuration activity.
The Scheduler event log displays events for the scheduled tasks configured via the Tasks tab. The event log includes task execution events and errors.
The Admin event log displays ExtremeCloud IQ Site Engine server and database administrative events, and ExtremeCloud IQ Site Engine user authentication and connection events. (In the legacy Console application, these events are included in the Console event log.)
You can manipulate the table data in several ways to customize the view for your own needs:
- Select the drop-down arrow to open the drop-down list and select an application to include in the Events table.
- Select the column headings to sort column data in ascending or descending order.
- Hide or display different columns by selecting a column heading drop-down arrow and selecting the column options from the menu.
- Select any row in the table to open a window that displays Event Details.
Event Log Column Definitions
Following are definitions of the Event Log table columns:
Severity — Indicates the potential impact of the event or trap. Hold the
mouse pointer over a Severity icon to display a tool tip that
provides the severity: Alert, Critical, Debug, Emergency, Error,
Info, Notice, Warning. For traps, this column shows the Severity as
defined in the trapd.conf file.
Event Type — Displays the application to which the event or trap is associated.
Category — Shows the category defined in the trapd.conf
file for traps. For other events, it indicates the source of the information, either a Console Poller, local log,
syslog, trap log, Error (java exceptions), etc.
Date/Time — Shows the date and time when an event or trap occurred.
Source — Shows the IP address of the host that was the source of the event or trap. If you want to display the source as a hostname (if available) you can set that option in the Suite-wide Alarm/Event Logs and Tables options.
Subcomponent — If the event or trap can identify a specific subcomponent of a device (or other source) which pinpoints the location of the problem, it is displayed here. One example of a subcomponent is an interface on a device.
Client — Displays the hostname of the source of the event.
User — The user that performed the action that triggered the event.
Type — Identifies the type of information for this row (event or trap).
Event — Shows the type of event or trap. For traps, this column shows the name of the event as
defined in the trapd.conf file.
Information — Shows an summary explanation of the event or trap.
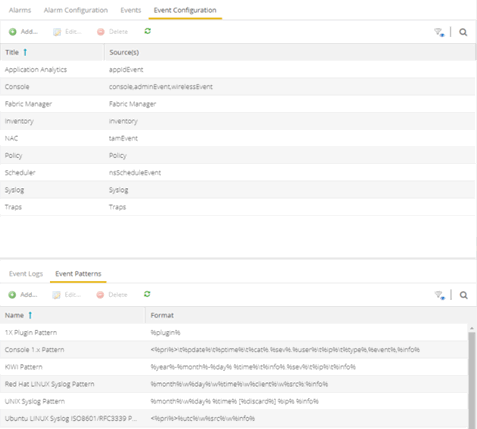
Event Configuration
Use the Event Configuration tab on the Alarms and Events tab to configure the source of information gathered in the event log, the name and location of the log file, and the format of the log pattern.
Buttons, Search Field, and Paging Toolbar
- Filter

- Use the filter functions to view, modify, apply, or remove filters from a table column. You can filter multiple columns in a table.
- Search

- The search tool enables you to search for full or partial matches
on fields in the table.
- Paging Toolbar

- The paging
toolbar provides four buttons that let you easily page through the table: first, previous, next, and last page.
- Refresh

- Use the refresh button to update the data in the table.
- Reset

- The reset button clears the search field and search results, clears all filters, and refreshes the table.
For information on related help topics:
![]()