Monitor ExtremeControl Health in ExtremeCloud IQ Site Engine
The following sections provide detailed information on how to use specific ExtremeCloud IQ Site Engine reports and NAC Manager features to monitor ExtremeControl health. These reports provide you with the information you need to monitor, analyze, and troubleshoot ExtremeControl problems.
- Monitor ExtremeControl Engine Performance
- Monitor ExtremeControl Engine Memory Use
- View ExtremeControl Engine Historical Data
- Monitor ExtremeControl Critical Events
- Monitor ExtremeControl Engine Load
- Monitor ExtremeControl End-System Health
- Create Alerts with ExtremeControl Notifications
- ExtremeCloud IQ Site Engine Custom Reports
Monitor ExtremeControl Engine Performance
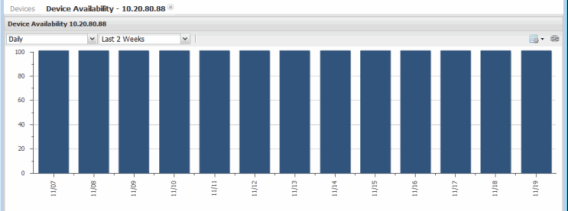
The ExtremeControl engine Device Availability report provides a historical overview of the engine status. The report shows at-a-glance when an engine is offline, or whether an engine is consistently on and offline over time. The report lets you quickly determine the specific date when an engine is unavailable without having to review log data to determine the date.
For a backup engine, the report can provide a good indication of possible engine or network issues that can go otherwise undetected until the moment when the engine is needed.
If the report indicates a problem, review the ExtremeControl engine logs for the dates in question (see ExtremeControl Engine Log Locations), to gain additional insight into the possible root cause of the problem.
Access the Device Availability report from the Network tab. Right-click on an ExtremeControl engine and select View Device Details > System > Device Availability, as shown here.
Accessing the Device Availability Report
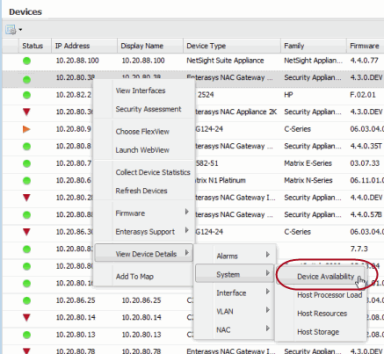
The ExtremeControl engine Device Availability report is displayed in a new tab, as shown below.
Device Availability Report
Monitor ExtremeControl Engine Memory Use
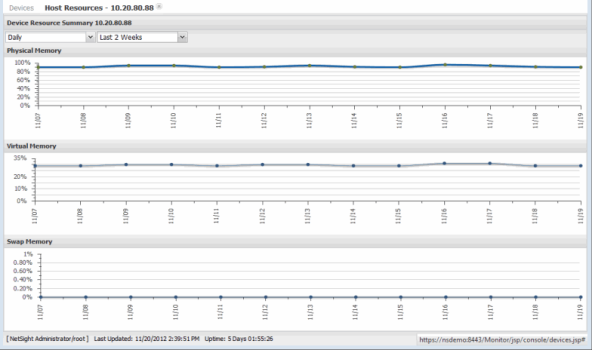
The ExtremeCloud IQ Site Engine Host Resources report lets you monitor physical, virtual, and swap memory usage on an ExtremeControl engine.
As you monitor an engine's physical and virtual memory, keep in mind that it is common for Linux-based systems (such as the ExtremeControl engine) to show high memory utilization. When a process consumes memory, the memory remains allocated to the process under the assumption it can be required in the future. If a different process calls for that memory, and it is not in use, it is made available.
It is also important to monitor swap memory statistics for your ExtremeControl engines. When an engine starts using swap memory, it indicates a potential issue, and more active monitoring of the engine can be required. Running commands such as the "top" command provides more accurate and up-to-date information on whether swap memory is actively being used, and which processes are consuming the highest memory and CPU.
Use the Network tab to access the Host Resources report for an ExtremeControl engine. Right-click on an ExtremeControl engine and select View Device Details > System > Host Resources, as shown here.
Accessing the Host Resources Report
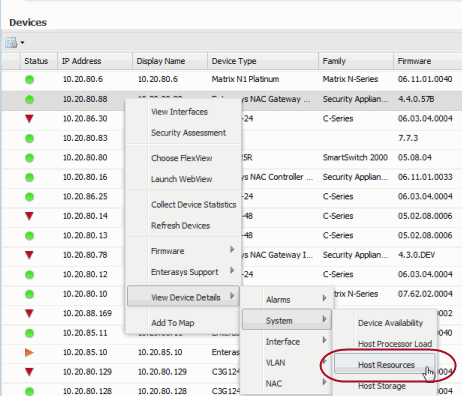
A Host Resources report for the ExtremeControl engine is displayed in a new tab, as shown below.
Host Resources Report
View ExtremeControl Engine Historical Data
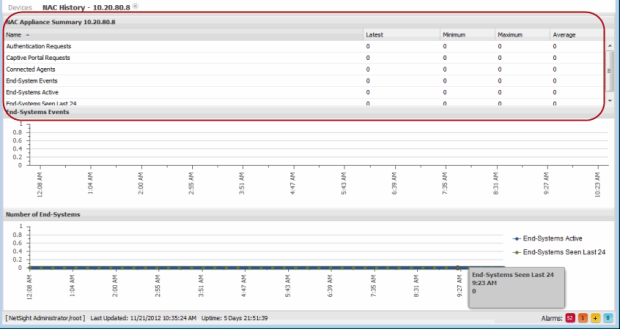
The NAC History report provides a detailed view of the overall ExtremeControl engine load based on critical ExtremeControl functions including authentication requests, captive portal statistics, and connected agents. The report displays the latest load data as well as minimum, maximum, and average statistics for an overview of activity by function. This provides a historical view for each individual engine and is similar to the ExtremeControl Engine Load report, which presents current load data for all engines.
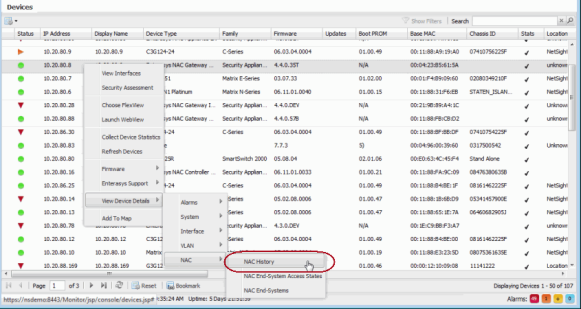
In ExtremeCloud IQ Site Engine, select the Network tab. Right-click on an ExtremeControl engine and select View Device Details > NAC > NAC History, as shown here.
Accessing the NAC History Report
The NAC History report is displayed in a new tab, as shown below. Look at the NAC Appliance Summary report for engine load data.
NAC History Report
Monitor ExtremeControl Critical Events
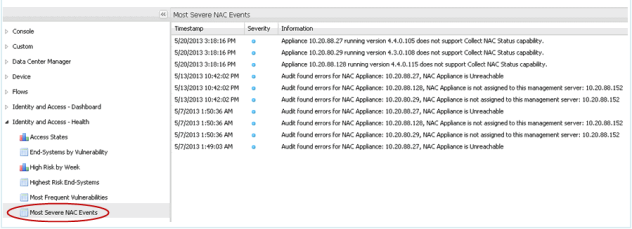
The ExtremeControl report on Most Severe ExtremeControl Events displays the 10 most severe ExtremeControl events. If the most recent events indicate a current issue, further in-depth review of the events can be required. A good place to start would be the server.log on the ExtremeCloud IQ Site Engine server (see Accessing the Server Log File in the ExtremeCloud IQ Site Engine Troubleshooting section of the ExtremeCloud IQ Site Engine Technical Reference) and the tag.log on the ExtremeControl engine (see ExtremeControl engine Log Locations). Depending on the error, additional debug options can be required to obtain more in-depth log data. For more information, see ExtremeControl Troubleshooting.
In ExtremeCloud IQ Site Engine, select the Reports tab. Expand the Identity and Access - Health folder and select the report.
Most Severe NAC Events Report
Monitor ExtremeControl Appliance Load
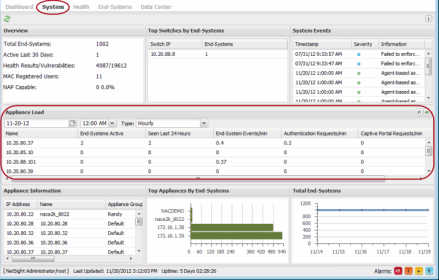
The ExtremeControl Appliance Load report provides a summary of end-system usage for each ExtremeControl engine on the network, including the number of active end-systems on the engine, and the number of authentication and captive portal requests per minute.
This report is useful for determining whether action is required in order to more evenly distribute the client load among available ExtremeControl engines. The report shows which engine has too many end-systems authenticating against it and which engine is underutilized and available to handle additional end-system requests. The report also provides helpful information for capacity planning and determining future needs for additional ExtremeControl hardware.
In ExtremeCloud IQ Site Engine, select the Control tab. Select System to view the Appliance Load report.
Monitor ExtremeControl End-System Health
The ExtremeControl Health reports provide information on overall end-system health.
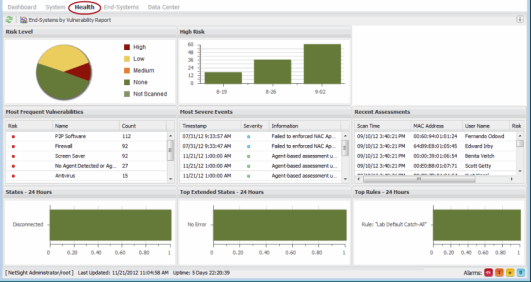
The Risk Level report helps you quickly determine the overall status of threats and vulnerabilities to the entire ExtremeControl environment. Select a specific section of the chart to launch a report of all end-systems that meet that criteria. Select the "High" portion of the chart to display a report of all end-systems that have a high-risk vulnerability.
The Most Frequent Vulnerabilities report lists the top vulnerabilities detected and the number of end-systems reporting that vulnerability. This report is useful in identifying specific areas of the user environment that needs immediate attention, or in determining the scale of a specific vulnerability.
In ExtremeCloud IQ Site Engine, select the Control tab. Select Health to view the end-system reports.
Create Alerts with ExtremeControl Notifications
ExtremeCloud IQ Site Engine lets you create alerts for when specific events or triggers take place in ExtremeControl. Each notification can be defined for a specific type and trigger. The notification type defines the source of the event that activates the notification, such as end-system, end-system group, user group, or health result. The trigger determines when a notification action is performed, based on filtering for a specific event. For example, if you select end-system group as your type, the trigger can be when entries in the group are added or removed.
Notifications can be further defined by specific conditions that, in addition to the trigger, determine when actions are performed. For example, you can configure a condition that filters notifications based on selected engines, user groups, and device groups, as well as ExtremeControl profile, time, and location.
Notifications can have a variety of actions configured such as sending an email, generating a syslog message, sending an SNMP trap, or launching a custom program or script. Email notifications can be customized so that only certain groups are notified for specific events based on the selected mailing list.
Use the Alarms & Events tab to configure ExtremeControl notifications.
ExtremeCloud IQ Site Engine Custom Reports
ExtremeCloud IQ Site Engine Custom Reports let you create specialized reports for monitoring ExtremeControl engine performance. Create reports on a variety of ExtremeControl engine statistics including CPU load, disk usage, memory usage, and device availability. Individual reports of interest can be bookmarked for ease of use in accessing the desired information.
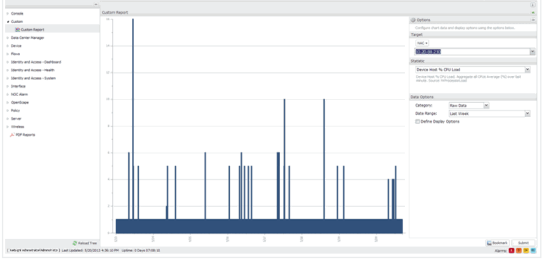
On the Reports tab, expand the Custom folder and select Custom Report. Use the Options panel to configure your custom report by selecting a report target (such as ExtremeControl), the statistic to monitor (such as CPU utilization), and the time period and date range to display. Select the Submit button to generate the report. An example report on ExtremeControl engine CPU utilization is shown below.
| TIP: | CPU usage can be monitored more closely in real-time using diagnostic tools such as the Linux "top" command. |
5/2026
26.02.13
Contents Subject to Change Without Notice