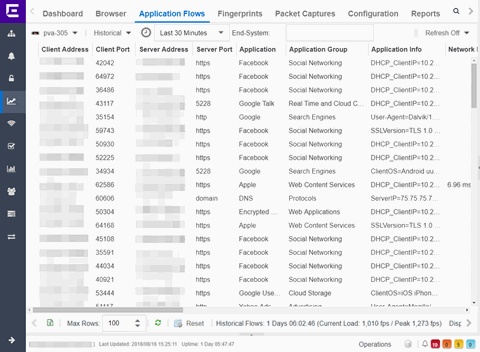
The Historical Flow table in the Application Flows tab displays historical flow data that you can use to analyze trends in your network. The Historical Flow table is not designed for long-term flow collection.

Hover over an application in the table to display switch data, which is an accumulation of multiple switches into single flow record, as well as the path that flow has taken.
By default, the top 100 entries are displayed in the table. However, you can change this value using the Max Rows field at the bottom of the view.
Text at the bottom of the table shows Base Flows, using X number of days, hh:mm:ss format, and including Current Load and Peak Load calculations in flows per second.
Following are definitions for the table columns:
Client Address
The IP address or hostname of the system where the flow originated. Select the Client address link to open a PortView for the client (if it is in the database) or a PortView for the switch configured as the NetFlow sensor.
Client Port
Either the TCP or UDP port on the client handling the flow.
Server Address
The IP address or hostname of the server handling the flow.
Server Port
Either the TCP or UDP port on the server handling the flow.
Application
The name of the application as identified by the ExtremeAnalytics engine using the Fingerprint database.
Application Group
The flow application group to which the application belongs.
Application Info
Additional information about the flow provided by the ExtremeAnalytics engine.
Network Response
The response time (in milliseconds) that it took for the TCP request to complete.
Application Response
The response time (in milliseconds) that it took the application request to complete.
Start Time
The start time.
Duration
The amount of time that the flow was active.
Last Seen
The last time the flow was seen.
Client Site
The name of the site that matches the client's IP address.
Server Site
The site of the server.
Detailed Site
Detailed site information
Protocol
The connection type protocol used by the flow.
Rate
The average bandwidth for the flow based on the flow duration.
Client Bytes
The number of bytes in this flow. For flows collected via Application Telemetry, this number can be estimated.
Client Packets
The number of packets in this flow. For flows collected via Application Telemetry, this number can be estimated.
Server Bytes
The number of bytes in this flow. For flows collected via Application Telemetry, this number can be estimated.
Server Packets
The number of packets in this flow. For flows collected via Application Telemetry, this number can be estimated.
Analytics Appliance
The engine to which the server is assigned.
For information on related help topics: