The Application Flows tab displays tables that present Historical, Bidirectional or Unidirectional client, server, and application flow data. To access the Applications Flows tab, open Analytics > Application Flows.
This Help topic provides information on the following topics:
Overview
The Application Flows tab includes several functions that enable you to filter and customize your table data.
- Appliance Engine
- If your network uses multiple ExtremeAnalytics engines, use the Engine menu to select an engine to use as the source for the flow data.
- Type
- Use the Type menu to select whether to display Historical, Bidirectional (aggregate flows) or Unidirectional (base flows) flow data.
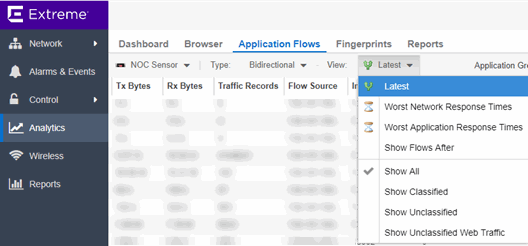
- View
- By default, the table displays the latest flows collected. Use the View menu to select different display options. The available options vary depending the flow type (bidirectional or unidirectional) selected.
- Latest — Displays the latest flows collected by the specified engine.
- Worst Network Response Times — Sorts the flows based on the worst TCP response time and displays the flows with the worst time at the top of the chart.
- Worst Application Response Times — Sorts the flows based on the worst application response time and displays the flows with the worst time at the top of the chart.
- Show Flows After — Enables you to select a start date and time for the flows displayed.
- Show All — Show all flows.
- Show Classified — Show only flows classified by an application fingerprint.
- Show Unclassified — Show only flows not classified by an application fingerprint.
- Show Unclassified Web Traffic — Show only web traffic that has not been classified by an application fingerprint.
- Application Group
- Use the Application Group menu to filter the table by application group.
- Search
-
Use the Search field at the top right of the table to filter specific flow information. For example, searching on "snmp" or "10.20.30.131/24" filters the table so only flow data related to SNMP or the given subnet is displayed. You can enter one or more filters simultaneously, separated by semicolons. Individual components of a filter is separated by commas.
For complete instructions on how to use the Flow Search, rest your
cursor on the Search field and read the tooltip (select the "more" link in the tooltip). Press the Reset button at the bottom left of the window to
clear the Search results and refresh the table.
You can also use the Search field to search for a specific application, user name, or IP address from your filtered results:
- Select a user name or IP address from the filtered search results to launch PortView, which provides a detailed topology context for the user.
- Enter meta= before the term for which you are searching includes all variations of that search term in the result set. For example, entering meta=extreme returns extremenetworks.com, www.extremenetworks.com, extreme.boston.com, and any other flows that include the word "extreme".
- Right-click on a flow to access a menu of options including the ability to:
- Add a new custom fingerprint based on the flow selected in the table.
- Show all fingerprints associated with the application in the selected flow.
- Create a UDP or TCP rule using the IP port.
- Search ExtremeCloud IQ Site Engine maps for the selected flow client.
- Open a Flow Details report for the selected flow (bidirectional flows only).
- Access a variety of reports for the flow.
- Refresh
- Use the Refresh drop-down list at the top right of the window to specify an interval (in seconds) at which the flows data automatically refreshes. To stop auto refresh, select the Refresh Off option.
Application Flows Tables
The columns included in the Application Flows tables vary, depending on the type of data flow you select (Historical, Bidirectional and Unidirectional). Additionally, right-click and select Start Packet Capture to save a packet capture of the flow on the Packet Captures tab.
Historical Flows
The Historical table displays short-term flow data storage you can use to determine trends in your network.
Bidirectional Flows
The Bidirectional table displays bidirectional flow data stored in memory. It provides aggregated flow data for a given
client, server, server port, application, and protocol. All matching flows are
aggregated to show the flow count, total duration, amount of data
transmitted, and additional information. The bidirectional report presents flow data for real-time troubleshooting purposes, and is not designed for historical long-term flow collection. A check mark ( ) in the table denotes a tracked application or a tracked site.
Unidirectional Flows
The Unidirectional table displays unidirectional flow data stored in memory. It provides the raw non-aggregated flow data received
from the flow sensors on the network. It presents flow data for real-time troubleshooting purposes, and is not designed for historical long-term flow collection. A check mark () in the table denotes a tracked application or a tracked site.
Report Features
The Application Flows tables include several report features and functions that enable you to drill down for more detailed application, site, response time, mapping and policy functions. The report features vary, depending on the type of data flow you select (Historical, Bidirectional and Unidirectional).
- Interactive Tables
- Manipulate table data
in several ways to customize the view for your own needs:
- Select the column headings to perform an ascending or descending sort on the column data.
- Hide or display different columns by selecting a column heading drop-down arrow and selecting the column options from the menu.
- Filter data in each column by selecting a column heading drop-down arrow and using the Filters option on the menu.
The sort and filter functionality for these two tables behaves differently than for other ExtremeCloud IQ Site Engine tables. In these tables, Max Rows are considered for display, and then sorting and filtering is applied to these rows. In other tables, sorting and filtering is applied to the entire table, and then Max Rows of the result is displayed. For example, if the Max Rows value is set to 50 and you create a filter for a specific IP address, only those 50 rows will be filtered for the IP, not all the flows maintained in memory on the server.
- CSV Export

- The CSV Export button enables you to save report data to a CSV file and to provide report data in table form.
- Bookmark

- Use the Bookmark button to save the search, sort, and filtering options you have currently set. It opens a new window for the current report with a link that can be bookmarked in your browser. You can then use the bookmark whenever you want the same search, sort, and filtering options.
- Max Rows
- By default, the top 100 entries are displayed in the table. However, you can change this value using the Max Rows field at the bottom of the view.
- Reset

- The Reset button enables you to clear the search fields and all filters, and to refresh the table.
- Aggregate / Base Flows
- Aggregate Flows (bidirectional table) and Base Flows (unidirectional table) data uses an X number of days, hh:mm:ss format and includes Current Load and Peak Load calculations in flows per second.
For information on related help topics: