The ExtremeAnalytics engine provides an application data collection function that collects and records information about network utilization. It includes:
- General Usage Collection — High-level application-centric data, collected hourly and in five-minute intervals.
- Extended Application Collection — Detailed data about all end-systems in the network, collected hourly.
Application data collection is based on network flow information. Network utilization for various objects in the network (called targets) is measured, collected, and used to create application data reports in ExtremeCloud IQ Site Engine.
| NOTE: | Ensure at least 4GB of swap space is available for flow storage or impaired functionality can occur. Use the free command to verify the amount of available RAM on your Linux system. |
This Help topic describes application data collection, including collection targets, statistics, and intervals. It also describes the different collectors used to perform the collection, as well as the sources for flow information.
Data Collection Overview
Application data collection is performed by the ExtremeAnalytics engine. The engine collects flow records from switches in your network. It then augments the collected flow data with detailed application information derived by network packet inspection, resulting in rich analytical data.
For example, if a NetFlow record reports 100 bytes transferred from client Workstation 1 to server Host A, then the collection process would add 100 bytes to the tally for Workstation 1, and 100 bytes to the separate tally for Host A. If the flow is identified as traffic for the Payroll application, then 100 bytes would be added to another tally for Payroll as well. And finally, 100 bytes is added to another tally for the entire network. At the end of a collection interval, the totals for client Workstation 1, server Host A, the Payroll application, and the entire network are written to the database.
Data from network flows is collected in an aggregated form for a period of time (called a collection interval), and then stored in the ExtremeCloud IQ Site Engine database. ExtremeCloud IQ Site Engine uses this data to provide reports that show how your network is being utilized.
To conserve space on your ExtremeCloud IQ Site Engine server hard drive, your ExtremeAnalytics engines only collect total flow records when the server hard drive drops below 10 GB of free space. If the ExtremeCloud IQ Site Engine server hard drive drops an additional 1 GB (under 9 GB of free space), your ExtremeAnalytics engines stop collecting all flow data.
| NOTE: | To change the differential threshold (the additional amount of free space reduction after which all records stop being collected), edit the RM_FREE_SPACE_MINIMUM_ALLOW_SUMMARY_KB value in the NSJBOSS.properties file. The value is set to 1,000,000 KB by default, so ExtremeAnalytics stops collecting all records when free space reaches 10GB - 1,000,000 KB = 9 GB. |
Collection Targets
Flow data is collected on objects in your network called targets. Some targets are physical, such as clients and servers, and some are logical, such as applications.
An ExtremeAnalytics engine can track the following target types:
- Client — The end-point of a flow that has the client role for that connection.
- Server — The end-point of a flow that has the server role for that connection.
- Application — An application in ExtremeAnalytics, identified through layer 7 analysis (for example, Facebook).
- Application Group — Application categories, such as Cloud Computing or Social Networking.
- Site — The client's physical location on the network, based on its IP address. Sites are used by ExtremeAnalytics to identify the physical location for the client of an application flow.
- Device Family — The kind of device determined for a client, such as Windows or iOS.
- Profile — An ExtremeControl profile assigned to a client.
In some cases, the engine can also track combinations of targets. For example, it can track the total number of bytes transferred from Workstation 1 for the Payroll application separately from Workstation 2 for Payroll, and from Workstation 1 for Facebook. These target and sub-target pairs provide for ExtremeCloud IQ Site Engine drill-down reports, for example, reports to show the top Payroll clients or the top applications for Workstation 1.
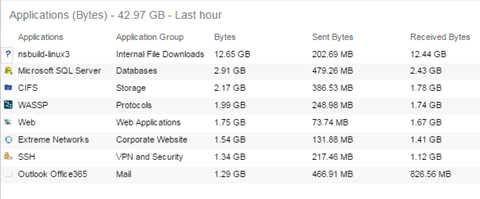
This report shows the top 10 applications seen on the network (based on bandwidth) during the last hour.
Collection Statistics
Collection statistics are quantitative data that can be collected for a target. This includes statistics directly reported in NetFlow records, such as bytes transferred, as well as information that can be derived indirectly, such as the number of unique clients seen using an application.
An ExtremeAnalytics engine can track the following statistics:
- Bytes — The number of bytes transferred in both directions, between the client and the server. Also known as bandwidth. You can track sent and received bytes as well as total bytes.
- Flows — The number of NetFlow records sent by the switch to report the traffic between the client and the server. You can track inbound and outbound flows as well as total flows.
- Clients — The number of unique clients associated with the target.
- Applications — The number of unique applications associated with the target.
- Network Response Time — The average amount of time to create a connection.
- Application Response Time — The average amount of time for a server to respond to a request.
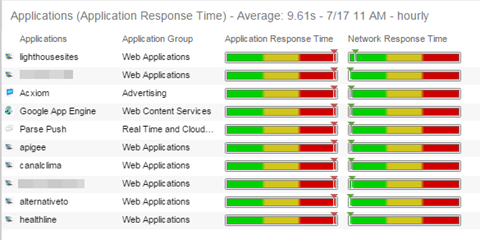
This report shows the average application response times for the top 10 applications during the last hour.
Collection Intervals
The ExtremeAnalytics engine collects and aggregates flow data for a period of time called an interval. At the end of the interval, the engine writes the totals to the ExtremeCloud IQ Site Engine database and a new interval begins, with new totals collected starting at zero.
Some statistics are collected and written to the database on an hourly interval. Other statistics are collected at a high-rate interval of every five minutes, providing for a more detailed picture of how traffic changes over time.
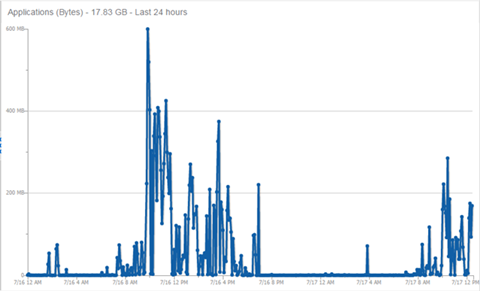
This report shows application bandwidth over 24 hours based on an hourly interval.
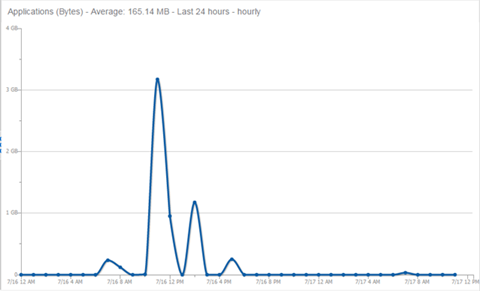
This report shows application bandwidth over 24 hours based on a high-rate interval.
All statistics can be collected over multiple intervals and averaged. When viewing report data, it is important to know the interval used for any average that is displayed.
Certain statistics, such as bytes and flows, can be collected over multiple intervals to provide a total over time, while other statistics, such as client count, cannot. To illustrate, the number of bytes seen in two hours would be the total of the number of bytes seen in each hour. However, the number of unique clients seen in two hours would not be the total of the number of unique clients seen in each hour, as some clients were probably seen in both hours.
Using Sites to Collect In-Network Traffic
While flow data collection can aggregate data for all flow traffic that is visible, it can be more useful to aggregate data for in-network flows only. These are flows used by clients that are located in your internal network. By collecting data for only in-network flows, the overhead of aggregating data over an interval can be reduced.
You can define your internal network by configuring sites. A site is a set of IP masks that defines a well-known portion of your internal network. You can use the World site to identify your entire internal network. If you have already reserved certain IP address ranges for certain physical sites on your network, you can create multiple sites that correspond to these reserved IP ranges. Multiple sites can be created to identify different buildings, sites, or geographical areas of your network. Any IP that matches any site is considered to be in-network. If you define multiple sites, you will be able to analyze data broken down by site.
Data Collector Types
There are two kinds of data collectors used in ExtremeAnalytics.
- General Usage Collectors — These are hourly and high-rate collectors that record the top targets during an interval. Many types of targets and target-pairs are supported.
- End-System Details Collector — This is an hourly collector that attempts to capture and record data for all in-network clients and servers that it detects. All traffic collected is tagged with site, profile, device family, and other attributes.
Data from these collectors is stored separately in the database. The collector data used in a report depends on the nature of the report. Higher-level information, such as top applications during an hour, will be based on general usage collector data, since it is relatively inexpensive to access. End-system details data might be used when data for a specific client or server is needed, or when the information requested is highly specific, for example, top applications used by Android devices in the London site.
General Usage Collectors
General usage collectors collect data about all instances of a target for the interval, and then record only the most significant targets (typically, the 100 most significant targets).
When the top targets are calculated for a collection interval, several different statistics can be used as a basis for choosing the most significant entries. For example, collectors can record the top applications based on bytes, and also record the top applications based on number of clients. For each type of target collected, there are different sets of bases used.
General usage collectors operate at both hourly and high-rate intervals. They can collect data from all flows or from in-network flows only.
Hourly General Usage Collectors
The following table describes the hourly data collected by the general usage collectors.
| Target | Sub-Target | Bases | Traffic Used |
|---|---|---|---|
| Total | In-Network Flows/ All Flows |
||
| Application | Bytes Received Bytes Transmitted Bytes Flows Receive Flows Transmit Flows Clients Network Response Time Application Response Time |
In-Network Flows | |
| Application | Client | Bytes | In-Network Flows |
| Application Group | Bytes Flows Clients |
In-Network Flows | |
| Client | Bytes Received Bytes Transmitted Bytes Flows Receive Flows Transmit Flows Applications Network Response Time Application Response Time |
All Flows | |
| Device Family | Bytes Flows Clients |
In-Network Flows | |
| Site | Bytes Flows Clients Network Response Time Application Response Time |
In-Network Flows | |
| Profile | Bytes Received Bytes Transmitted Bytes Flows Receive Flows Transmit Flows Network Response Time Application Response Time |
In-Network Flows | |
| Threat | Bytes Flows Application Response Time Network Response Time Received Bytes Sent Bytes Inbound Flows Outbound Flows |
In-Network Flows | |
| Threat | Threat End-System Pair | Bytes Flows Application Response Time Network Response Time Received Bytes Sent Bytes Inbound Flows Outbound Flows |
In-Network Flows |
| Server | Bytes Received Bytes Transmitted Bytes Flows Receive Flows Transmit Flows Network Response Time Application Response Time |
All Flows | |
| Application | Device Family | Bytes Flows Clients |
In-Network Flows |
| Application | Profile | Bytes Flows Clients |
In-Network Flows |
High-Rate General Usage Collectors
The following table describes the high-rate data collected by the general usage collectors.
| Target | Sub-Target | Bases | Traffic Used |
|---|---|---|---|
| Total | In-Network Flows/ All Flows |
||
| Application | Bytes Flows Clients |
In-Network Flows | |
| Application Group | Bytes Flows Clients |
In-Network Flows | |
| Device Family | Bytes Flows Clients |
In-Network Flows | |
| Site | Bytes Flows Clients |
In-Network Flows | |
| Profile | Bytes Flows Clients |
In-Network Flows |
End-System Details Collector
The end-system details collector tracks client/application target pairs.
Unlike general usage collectors, this collector attempts to record data for all in-network clients and servers it sees during the hour. For each client or server, it records data for up to 10 applications, plus an "other" category to capture the remaining traffic. Information such as location, device family, and profile are also recorded for each end-system.
The large number of targets recorded each hour and the amount of detail recorded for each one, can result in a large volume of data being stored in the database. In order to prevent disk space from being over-utilized, there is a total limit of 50,000 clients which can be recorded each hour across all ExtremeAnalytics engines. There is also a 25,000 client limit per engine for most license types. However, the per-hour total limit is 100 clients across all ExtremeAnalytics engines.
Flow Information Sources
The ExtremeAnalytics engine uses NetFlow or SFlow records from the switches and wireless controllers in your network as a source for flow data. Information such as IP addresses, ports, and bytes transferred comes from this flow data source.
This data is augmented with additional layer 7 application information produced by the ExtremeAnalytics engine through deep packet inspection. Information such as application name and network response time comes from this source.
There is additional information that can be obtained from sources other than NetFlow/SFlow records and deep packet inspection.
| NOTE: | Most of these sources rely on Access Control data. If Access Control is part of your network configuration, then Access Control integration can be enabled (see instructions below) to provide access to these sources. Site data is obtained from sites configured in ExtremeCloud IQ Site Engine. |
The following is a list of information that can obtained from different sources:
- Hostname — The client or server's hostname can be derived using Access Control. Access Control integration must be enabled.
- Site — The site for a flow is the site of the client in the flow. Client and server sites are derived from the sites configured on the Network tab. If a client does not match a site, then the site is empty. If a flow has a site, the flow is considered to be in-network.
-
Detailed Site — Detailed site information is derived from the switch and port information resolved for the client end-system. Access Control Integration must be enabled.
- Device Family — The device family is a general description of the operating system detected in the client, for example, Windows, Linux, or Android. The device family is derived from network packet inspection. The device family can also be provided by Access Control, if Access Control integration is enabled.
- Profile — The client's profile is derived from the Access Control profile assigned to the client end-system. Access Control integration must be enabled.
- Username — The client's username is derived from network packet inspection. The username can also be provided by Access Control, if Access Control integration is enabled.
It is possible that different sources can provide different values for the same information. For example, network packet inspection can provide the device family name of Window 7, whereas Access Control can provide the device family name of Windows.
Enabling ExtremeControl Integration
If your network configuration includes ExtremeControl, ExtremeControl data can be integrated with flow data to provide additional information. Access Control integration is only useful if you are collecting flows for end-systems managed by ExtremeControl.
When ExtremeControl integration is enabled, if a client in a flow matches an end-system in ExtremeControl, then:
- The client hostname in the flow is derived from the end-system.
- The device family in the flow is derived from the end-system.
- The username in the flow is derived from the end-system.
- The profile in the flow is derived from the end-system's ExtremeControl profile.
- The detailed site in the flow is derived from end-system data.
If a server in a flow matches an end-system in ExtremeControl, then:
- The server hostname in the flow is derived from the end-system.
To enable ExtremeControl integration on the ExtremeAnalytics engine, perform the following steps to enable ExtremeControl Integration on each ExtremeAnalytics engine where you want to use ExtremeControl data:
- Access the Analytics tab.
- Expand each ExtremeAnalytics engine and select Advanced Configuration. In the right panel under Configuration Options, select the Enable ExtremeControl Integration option.
- If your Access Control engines are using Communication Channels, you must select the Access Control Communication Channel option and enter the channel name. The ExtremeAnalytics engine is only able to access end-systems in its channel.
- Select Save.
- Enforce your ExtremeAnalytics engines.
Reports
Data gathered from flow usage collection is the basis of many reports in the ExtremeCloud IQ Site Engine's Analytics tab. When collection is enabled, these reports begin to exhibit data.
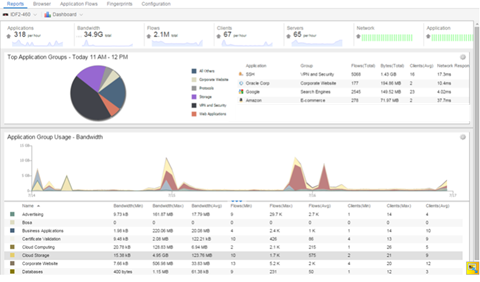
Dashboard Report
The following screen-shot shows the main Dashboard report. It contains data produced by the hourly General Usage collectors, and displays data for a specific hour. Across the top are the hour’s totals. Below them are Top Application Groups, as a chart, and Top Applications, as a table, for the same hour. There is also Application Group Usage over the last 3 days, as a chart and as a table.
Note that data from different ExtremeAnalytics engines is maintained separately. If you have more than one ExtremeAnalytics engine, you need to select which engine to view, using the engine menu in the top-left corner.
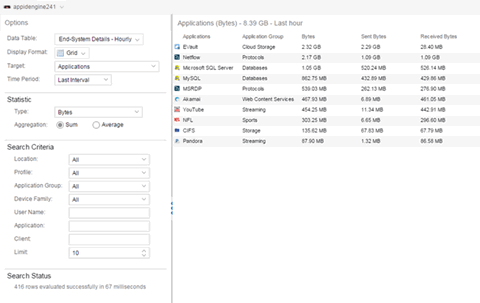
Browser Reports
The Browser provides special reports that lets you select the targets, statistics, and collection interval for your report, as well as define search criteria to further filter report data. Using the Browser, you can create custom queries that provide greater flexibility in defining what data to display and how to display it. When you create a Browser report, you select which type of network activity data to use: end-system details (always hourly), application data hourly, or application data high-rate. For additional information, see Applications Browser.
The following screen-shot shows an example of a Browser report showing application/device family bandwidth usage for the last hour.
For information on related help topics:
![]()