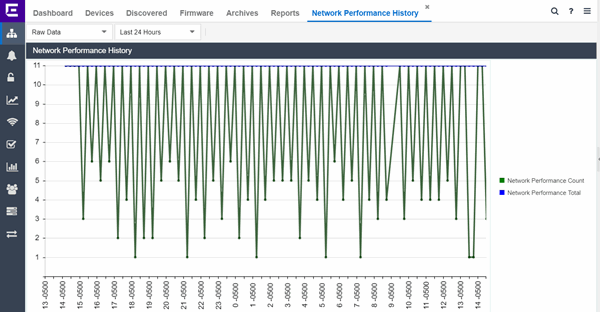
The Network Performance History report contains a graph that displays the number of sites that have no tracked applications or network services with slower-than-expected network response times (green) and the total number of network locations (blue) for the duration you define. The values here are the values displayed in the Network Performance ring chart over the time span you define.
| NOTE: | The graph displays network locations observed on all of your ExtremeAnalytics engines. |
Select the increment between which ExtremeCloud IQ Site Engine analyzes network locations from the data drop-down list. Available options are Raw, Hourly, or Daily data.
Select the time span for which the report displays from the time span drop-down list. Available options are Last 24 Hours, Yesterday, Last 3 Days, Last Week, Last 2 Weeks, Last Month.
For information on related help topics: