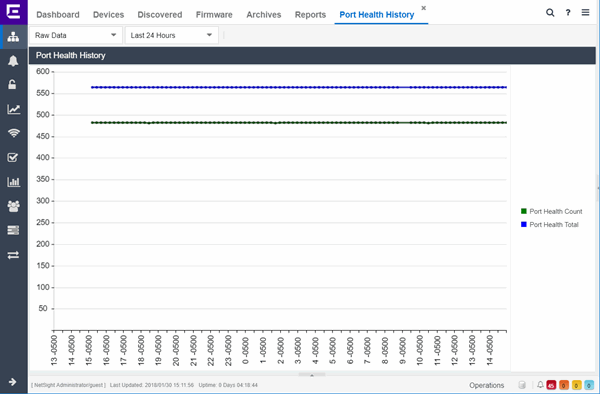
The Port Health History report provides detailed information about the ports for which error statistics are above the threshold you configure (green) and the total number of ports (blue). A port is displayed in the report if the port is up and historical data collection has been enabled on the device long enough for statistic collection. The values here are the values displayed in the Port Health ring chart over the time span you define.
| NOTE: | Use the Port Health Chart section of the Impact Analysis options to configure the threshold ExtremeCloud IQ Site Engine uses to determine port error rates. |
Select the increment between which ExtremeCloud IQ Site Engine analyzes ports from the data drop-down list. Available options are Raw, Hourly, or Daily data.
Select the time span for which the report displays from the time span drop-down list. Available options are Last 24 Hours, Yesterday, Last 3 Days, Last Week, Last 2 Weeks, Last Month.
For information on related help topics: