Selecting Impact Analysis in the left panel of the Options tab provides the following view, where you can edit settings associated with the Impact Analysis dashboard. The right-panel view changes depending on what you select in the left-panel tree. Expand the Impact Analysis tree to view all the different available options. These settings apply to all users.
Changing a value from the system default causes a Default Value button to appear. Selecting this button changes the field back to the system default value.
Select the link for information on the following Impact Analysis options:
Availability Collector
Use these options to configure the threshold settings for the Site and Device Availability Charts in the Impact Analysis dashboard.
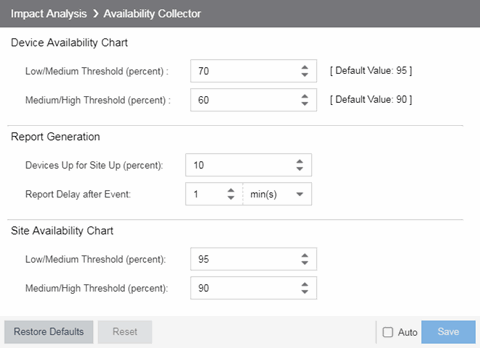
Device Availability Chart
- Low/Medium Threshold (percent)
- Indicates the percentage of devices on your network that ExtremeCloud IQ Site Engine can reach. If the value falls below the percentage entered here, the Impact Status of the Device Availability chart moves from Low to Medium. For devices to be included, data collection must be enabled.
- Medium/High Threshold (percent)
- Indicates the percentage of devices on your network that ExtremeCloud IQ Site Engine can reach. If the value falls below the percentage entered here, the Impact Status of the Device Availability chart moves from Medium to High. For devices to be included, data collection must be enabled.
Report Generation
- Devices Up for Site Up (percent)
- Indicates the percent of devices included in a site that ExtremeCloud IQ Site Engine can reach. If the value falls below the percentage entered here, the ExtremeCloud IQ Site Engine considered the site down.
- Report Delay after Event
- Indicates the amount of time ExtremeCloud IQ Site Engine waits before reporting a device is down.
Site Availability Chart
- Low/Medium Threshold (percent)
- Indicates the percentage of devices included in a site that ExtremeCloud IQ Site Engine can reach. If the value falls below the percentage entered here, the Impact Status of the Site Availability chart moves from Low to Medium. For devices to be included, data collection must be enabled.
- Medium/High Threshold (percent)
- Indicates the percentage of devices included in a site that ExtremeCloud IQ Site Engine can reach. If the value falls below the percentage entered here, the Impact Status of the Site Availability chart moves from Medium to High. For devices to be included, data collection must be enabled.
Capacity/Health Collector
Use these options to configure the thresholds for the Port Capacity and Port Health Charts in the Impact Analysis dashboard.
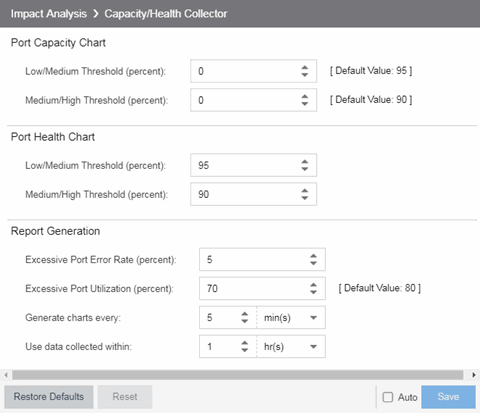
Port Capacity Chart
- Low/Medium Threshold (percent)
- Indicates the percentage of ports on your network with an acceptable level of utilization. If the value falls below the percentage entered here, the Impact Status on the Port Capacity chart moves from Low to Medium. For ports to be included, data collection must be enabled.
- Medium/High Threshold (percent)
- Indicates the percentage of ports on your network with an acceptable level of utilization. If the value falls below the percentage entered here, the Impact Status on the Port Capacity chart moves from Medium to High. For ports to be included, data collection must be enabled.
Port Health Chart
- Low/Medium Threshold (percent)
- Indicates the percentage of ports on your network with an acceptable error rate. If the value falls below the percentage entered here, the Impact Status on the Port Health chart moves from Low to Medium. For ports to be included, data collection must be enabled.
- Medium/High Threshold (percent)
- Indicates the percentage of ports on your network with an acceptable error rate. If the value falls below the percentage entered here, the Impact Status on the Port Health chart moves from Medium to High. For ports to be included, data collection must be enabled.
Report Generation
- Excessive Port Error Rate (percent)
- Indicates the port error rate, in percent of total port traffic, above which ExtremeCloud IQ Site Engine considers the port error rate excessive. A port error rate below this percentage is considered acceptable.
- Excessive Port Utilization (percent)
- Indicates the port utilization, in percent of total port traffic, above which ExtremeCloud IQ Site Engine considers the port utilization excessive. A port utilization below the percentage entered here is considered acceptable.
- Generate charts every
- Indicates the interval between which ExtremeCloud IQ Site Engine polls ports to generate the Port Capacity and Port Health charts.
- Use data collected within
- Indicates the amount of time within which the data collected for a report is valid.
Configuration Collector
Use these options to configure the thresholds of the Archived Devices and the Devices with Reference Firmware charts in the Impact Analysis dashboard.
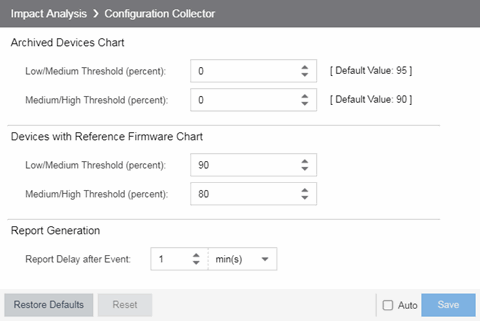
Archived Devices Chart
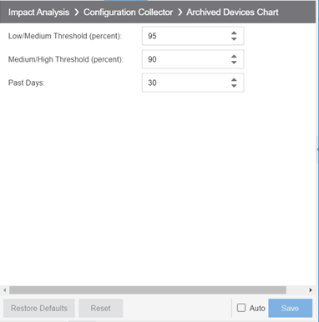
- Low/Medium Threshold (percent)
- Indicates the percentage of devices for which an archive was created within the duration you select in the Past Days field. If the value falls below the percentage entered here, the Impact Status on the Archived Devices chart moves from Low to Medium. For ports to be included, data collection must be enabled.
- Medium/High Threshold (percent)
- Indicates the percentage of devices for which an archive was created within the duration you select in the Past Days field. If the value falls below the percentage entered here, the Impact Status on the Archived Devices chart moves from Medium to High. For ports to be included, data collection must be enabled.
- Past Days
- Use the Past Days field to select the duration within which devices' archive activity is monitored by the Configuration Collector. Set the duration for any value between 1 and 100 days.
Devices with Reference Firmware Chart
- Low/Medium Threshold (percent)
- Indicates the percentage of devices on which firmware you define as a reference image is installed. If the value falls below the percentage entered here, the Impact Status on the Devices with Reference Firmware chart moves from Low to Medium. For ports to be included, data collection must be enabled.
- Medium/High Threshold (percent)
- Indicates the percentage of devices on which firmware you define as a reference image is installed. If the value falls below the percentage entered here, the Impact Status on the Devices with Reference Firmware chart moves from Medium to High. For ports to be included, data collection must be enabled.
Report Generation
- Report Delay after Event
- Indicates the amount of time ExtremeCloud IQ Site Engine waits before reporting a device does not have an archive created in the last 30 days or does not have a reference firmware image installed.
Performance Collector
Use these options to configure the thresholds of the Application and Network Performance charts in the Impact Analysis dashboard.
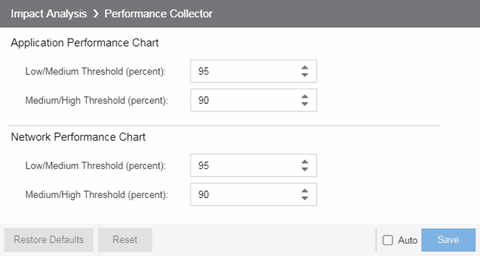
Application Performance Chart
- Low/Medium Threshold (percent)
- Indicates the percentage of tracked applications with a response time in the expected or better than expected range. If the value falls below the percentage entered here, the Impact Status on the Application Performance chart moves from Low to Medium. The expected response time is established using an average of the previously observed response times.
- Medium/High Threshold (percent)
- Indicates the percentage of tracked applications with a response time in the expected or better than expected range. If the value falls below the percentage entered here, the Impact Status on the Application Performance chart moves from Medium to High. The expected response time is established using an average of the previously observed response times.
Network Performance Chart
- Low/Medium Threshold (percent)
- Indicates the percentage of network services with a response time in the expected or better than expected range. If the value falls below the percentage entered here, the Impact Status on the Network Performance chart moves from Low to Medium. The expected response time is established using an average of the previously observed response times.
- Medium/High Threshold (percent)
- Indicates the percentage of network services with a response time in the expected or better than expected range. If the value falls below the percentage entered here, the Impact Status on the Network Performance chart moves from Medium to High. The expected response time is established using an average of the previously observed response times.
For information on related help topics: