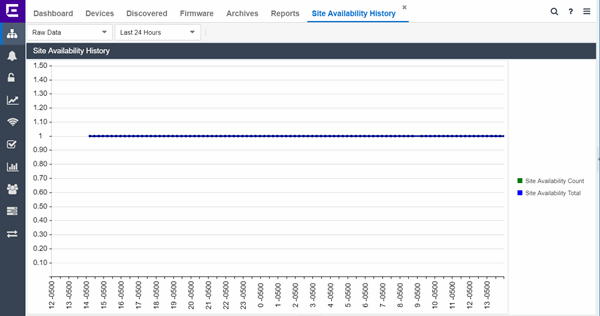
The Site Availability History report contains a graph that displays the number of sites with a Status of Up (depending on the number of devices with which ExtremeCloud IQ Site Engine can communicate) (green), and the total number of sites that have devices (blue) for the duration you define. The values here are the values displayed in the Site Availability ring chart over the time span you define.
Use the Devices Up for Site Up (percent) field on the Impact Status Options tab to configure the threshold ExtremeCloud IQ Site Engine uses to determine if a site is up. The threshold is calculated as the ratio of devices in a site with a Status of Up to the total number of devices in the site.
Select the increment between which ExtremeCloud IQ Site Engine analyzes sites from the data drop-down list. Available options are Raw, Hourly, or Daily data.
Select the time span for which the report displays from the time span drop-down list. Available options are Last 24 Hours, Yesterday, Last 3 Days, Last Week, Last 2 Weeks, Last Month.
For information on related help topics: