The Network > Devices tab contains Map features that let you create geographic and topological maps of the devices and floor plans of wireless access points (APs) on your network. The advanced Map features include wireless coverage maps to identify coverage trouble spots for your wireless network.
Wireless Coverage
After you finish your custom floor plan and save the map, the map is ready to display wireless coverage information.
- Select View > Wireless Coverage > Show Coverage to show wireless coverage of the APs on the map and to enable the wireless coverage options.
- Use the View > Wireless Coverage menu available at the top of the map to select from the following coverage display options.
- Mode — Select from the different options for coverage display:
- Signal Strength— Use this mode to view AP signal strength. Set the Band, Access Points, and Minimum RSS options.
- Channel Coverage — Use this mode to view channel coverage and AP health. Set the Select Channel, Band, and Access Points options. This mode provides a graphical overview of channel allocation, helping to visualize radio management issues or locate potential interference.
- Data Rate — This mode shows a coverage map indicating the expected physical rate for all of the cells on the floor. Set the Minimum Physical Rate, Band, and Access Points options. Use this mode to ensure proper wireless performance throughout the network.
NOTE: Wireless coverage maps are divided into cells. Each cell displays a signal strength with which it is associated, used to determine wireless coverage and the location probability of a user. - Location Readiness — Use this mode to view the expected quality of location search results for each map cell, given the current placement of APs. Colors denote readiness for each cell:
- Green — Good readiness. There are four or more APs with visibility of the cell, with at least three of them within 20 meters.
- Yellow — Moderate readiness. There are three APs with visibility of the cell, with at least two within 20 meters.
- Orange — Poor readiness. There are less than three APs with visibility of the cell.
- Red — No triangulation. Only Cell of Origin location results are available in this area.
- Select Channel — Used to select the channels to view for Channel Coverage mode. If "All" is selected, each distinct channel is assigned a color as shown in the legend at the foot of the map, and the color brightness varies to indicate coverage intensity. Selecting a single channel shows a coverage map for that one channel's signal strength and displays a Channel Health window that shows the average and maximum utilization and noise levels for each applicable AP.
- Utilization — The percentage of busy time for the channel during the last 100 seconds. A channel is busy either because of an interference with energy above a threshold (-62dBm) or because of an active transmission of other stations or APs. This is an indicator of the congestion and interference on the channel.
- Noise — The noise floor measured by the AP on the 802.11 channel over the last 30 seconds. Noise floor is measured during the quiet time, between the valid transmission or reception of 802.11 frames.
- Min. Physical Rate — Used for Data Rate mode to set the minimum physical rate to display. A legend for the Physical Rate by color is visible at the bottom of the map.
- Band — Select the desired band (radio frequency).
- Access Points — Select which access points to include. These buttons allow you to select or deselect all APs. This option also contains a checkbox that allows you to use default values if a radio is off. When this checkbox is selected, you can view an estimate of coverage using default values; otherwise, no coverage is shown.
- Minimum RSS — Used to set the minimum RSS to display (default is -80) for Signal Strength mode. A legend for the RSS by color is visible at the bottom of the map.
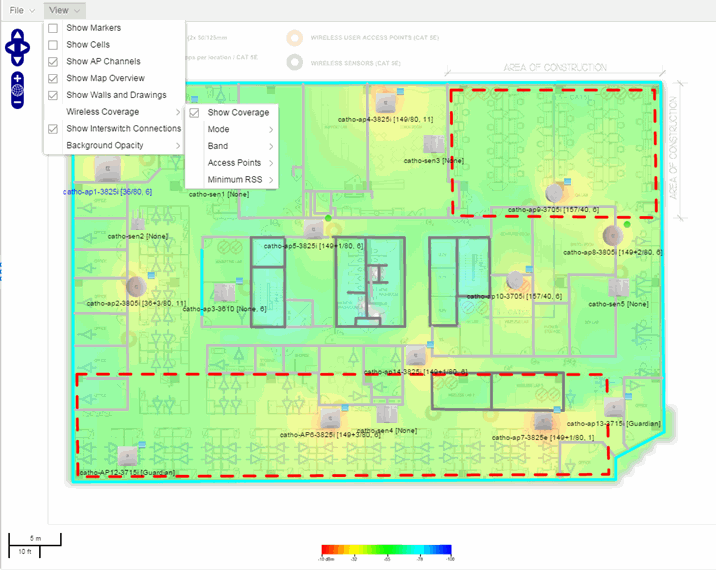
Once these options are set, the map displays the selected coverage information. The following map shows signal strength coverage.
Wireless Map Limits
The following sections provide information about limits for wireless client location and wireless coverage maps.
Active Client Tracking
The number of active clients the location engine on the wireless controller can track simultaneously depends on the wireless controller model. Refer to your wireless controller documentation for information.
Maximum Number of Maps
A wireless controller on which version 10.01.01 or higher is installed can store a maximum of 200 maps. Wireless controllers running a version lower than 10 can store a maximum of 100 maps.
Maximum Number of APs per Floor Plan
A single floor plan allows a maximum of 2,000 APs when version 10.01.01 is installed on the wireless controller. A floor plan with a wireless controller on which a version lower than 10 is installed allows 100 APs.
For information on related help topics:
For information on related topics: