The Network > Devices tab contains Map features that let you create geographic and topological maps of the devices and floorplans of wireless access points (APs) on your network. The advanced Map features include custom floorplan design, triangulated wireless client location, and wireless coverage maps to identify coverage trouble spots for your wireless network.
This Help topic provides the following information:
- Overview of Advanced Map Features
- Prerequisites
- Designing a Floorplan
- Wireless Client Location
- Wireless Coverage
- Import and Export Maps
- Show Application Data
- Wireless Map Limits
For information on viewing and searching maps, see View and Search Maps.
Overview
ExtremeCloud IQ Site Engine advanced Map features provide the following enhanced functionality:
- Detailed Floorplans — Advanced map functionality lets you create detailed floorplans for both your wired and wireless networks. Using floorplans provides greater accuracy in calculations of wireless client location and displays wireless device coverage. You can upload and modify existing floorplans or create new floorplans from scratch. Use the Map drawing tools and menus to specify wall types, material, and thickness and then configure AP locations, type, and orientation.
- Wireless Location — Advanced location (triangulation) enhances client location results, improving visibility when investigating wireless trouble spots. Colored distribution displays high, medium, and low confidence locations, with the client icon displayed in the highest confidence location. Using floorplan data, a single client's location is triangulated based on the client's contact with multiple access points in the covered area. The floorplan wall type information helps determine the degradation of signal strength that occurs as a wireless radio signal passes through the walls. This helps define the probable distance of a client from a given access point. You need at least three access points to report triangulated location. You can also view time-lapse location coverage for a client, using historic triangulated location results.
- Wireless Coverage — This feature provides a graphical view of wireless coverage, allowing quick identification of possible coverage trouble spots. Wireless coverage is displayed using different colors to indicate radio signal strength based on the distance from access points included on the map. Coverage is determined by computing the approximate radio signal strength at fixed distances from access points, with floorplan and wall information used to provide accuracy in the signal strength computation.
- Import and Export Maps — This feature lets you export floorplan maps to a ZIP file, and import an exported map if needed.
- Show Application Data in Maps — Use map links tied to ExtremeAnalytics network locations to display network application flow data in a map.
Prerequisites
In order to create or edit Maps, you must be a member of an authorization group assigned the OneView > Maps > Maps Read/Write Access capability.
The following requirements pertain to wireless location and coverage features:
- The ExtremeWireless Controller must be a model C25 or better, running firmware version 8.31 or higher.
- The Location Engine on the wireless controller must be enabled. (For information on how to enable the Location Engine, refer to the Extreme Networks Wireless Convergence Software User Guide.)
- The Access Points must be model 37xx, 38xx, or 39xx.
Designing a Floorplan
You can design and enhance floorplans of your wired and wireless network environment by editing your maps using the drawing and style tools. These editing tools allow you to create detailed visual representations of your network. You can also use floorplans to provide greater accuracy in the calculation of AP client location and in determining signal strength coverage for the wireless devices on your network.
| NOTE: | You can only use an AP in one floorplan. |
Managed wireless controllers are automatically synchronized to match map floorplan data. If the floorplan data defined in ExtremeCloud IQ Site Engine maps is not consistent with data on the controller, the controller is updated accordingly.
| NOTE: | To prevent the automatic synchronization between ExtremeCloud IQ Site Engine maps and controllers, go to the Administration > Diagnostics tab, access System > Map Server Details from the left-panel and select the Do Not Upload Maps checkbox. Selecting this checkbox also prevents manually triggered map changes from being uploaded to a controller. |
In floorplan design, use the map drawing tools to draw walls (or other objects) over an existing map image or on a blank canvas. The Style menu allows you to specify wall thickness, color, and wall materials.
The wall information from the floorplan is used to help determine the degradation of signal strength that occurs as a wireless radio signal passes through the walls, and helps define the probable distance of a client from a given access point. ExtremeCloud IQ Site Engine uses the wall information to provide accuracy in determining wireless device signal strength.
A floorplan can be created with or without a reference background image, however it is much easier to use the drawing features with an existing image. (The Map feature supports images in PNG, GIF, and JPG (without transparency) formats.) For example, you can trace the outline of a floorplan image using the drawing tools to provide the wall information used for wireless calculations. You can use the Style and Wall menus to specify different wall material types, wall thickness, and wall color to customize the appearance of the floorplan.
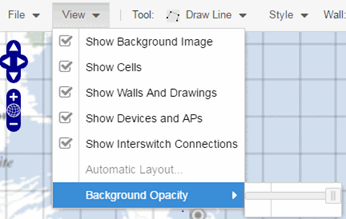
When editing a floorplan, use the View menu to select whether to view or hide the background image, map cells, floorplan walls and drawings, devices and APs, and interswitch connections. You can also set the background image opacity.
The following steps provide a workflow for creating a floorplan showing the exterior and interior walls of a building. By drawing the walls over an existing floorplan image, you can add information that provide greater accuracy in wireless calculations.
- Create and configure a new map.
- Launch ExtremeCloud IQ Site Engine and select the Network > Devices tab.
- In the left-panel Groups/Maps navigation tree, right-click on the World map (or any other map that you want as the parent of the new map) and select Maps > Create New Map.
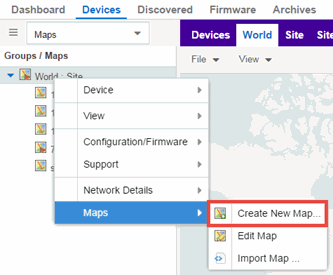 The Create New Map window opens.
- Enter a name for the Map.
- Open the Map Properties window by selecting File > Properties.
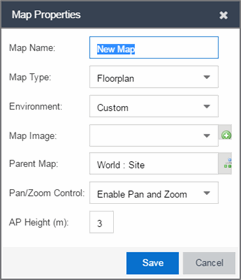
- Change the Map Type drop-down list to Floorplan.
- Set the Environment option to Custom. This allows you to draw walls over the existing image.
- Upload the floorplan image you want to use in the Map Image field. The Map feature supports images in PNG, GIF, and JPG (without transparency) formats. The maximum image size is 3000 x 2000 pixels. Images that are larger than this are automatically scaled down to the maximum size allowed.
- Set the AP Height property. This value is the distance from the floor to the AP position on the wall or ceiling in meters. This is a single value used for all access points. Setting a reasonable value helps with the accuracy of the location feature. The default for this value is three meters, which is at the top of a wall with a nine foot ceiling.
- Select Save to save the map and display the image.
- Set the map scale. It is important to set the scale before adding devices or walls, since changing the scale later may cause the object positions to be realigned. Try to make the scale as accurate as possible, as this affects triangulation accuracy.
- Select File > Edit to open the map in edit mode.
- Select the map scale in the map's footer panel to open the Set Map Scale window. (You can also access the Set Map Scale window from the Tools menu.)

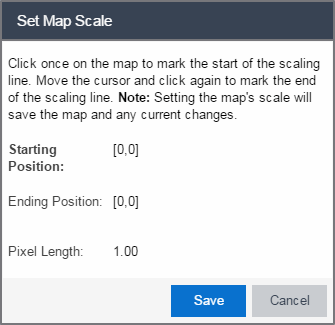
- To set the scale, you must measure something in the map using a scaling line, and then set the measurement for the line. For example, in an office floorplan you could measure a scaling line on the opening of an office. If you know that the office doors are 33 inches wide, enter that as the scaling line measurement.
- Select on the map to mark the start of the scaling line. Move the cursor and select again to mark the end of the scaling line.
- Enter the line length and units.
- Select OK. The map scale is automatically adjusted and the map is saved.
- Draw floorplan walls. Select the Edit button to open the map in edit mode. By default you see a grid of cells displayed over the background image. (It can be turned off in the View menu.) This grid can help with positioning walls and access points. Add walls to the floorplan using the drawing tools accessed from the Tools menu (at the upper left corner of the Map main view).
- Define an exterior wall. The exterior wall is used to define the floorplan area included in wireless client location and wireless coverage maps, and should be drawn around the entire perimeter of the floorplan area, without any gaps.
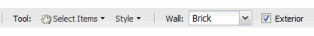
- Select the appropriate drawing tool from the Tools menu. Use the Style menu to configure the wall color, thickness, and transparency. Select the wall material using the Wall drop-down list and select the checkbox to specify that the wall is an exterior wall.
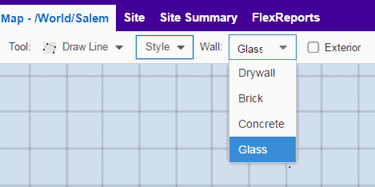
- Draw the exterior wall using the selected drawing tool. You can double-click or hit Escape to terminate the drawing.
- Use these same steps to draw the remaining walls on your floorplan. Be sure to deselect the Exterior checkbox for the other walls.
You can trace over existing walls on the floorplan or add new walls, if necessary. Focus on high attenuation walls like concrete or large sections of glass. It is not necessary to incorporate walls and structures that do not fully divide the space, such as half-walls or cubicles.
Ensure that the wall positioning is as accurate as possible, and define the proper material for each wall. Select a material that most closely represents the actual wall construction if it is different than the available options. Keep your colors consistent for the various wall types. The more accurately the map reflects the true environment, the more precise the wireless location and coverage results are in the map.
To remove a line or shape, select Select Items in the Tool menu, select the shape, and press Delete, or right-click on the shape and select Remove from Map from the menu. Use the Ctrl+Z key combination to restore deleted items back to the map. Selecting Ctrl+Z multiple times undoes multiple deleted items in the reverse order in which you deleted them.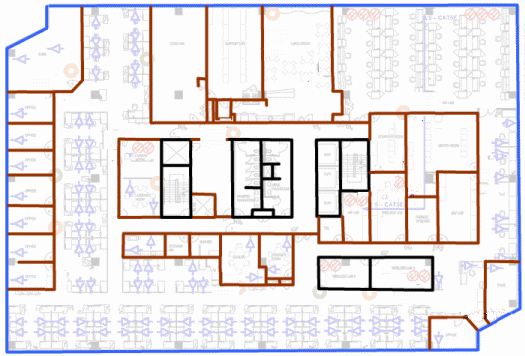
- While editing, use the View menu to select whether to view or hide the background image, map cells, floorplan walls and drawings, devices and APs, and interswitch connections. You can also select an automatic layout and set the background image opacity.
- Add your APs to the map. In Edit mode, a panel that lists equipment available to add to the map is visible beneath the properties panel. The display is filtered on either the currently discovered devices or the APs known to wireless controllers on your network, depending on your selection (APs or Devices) in the panel title bar. You can use the search field to locate a specific device or AP.
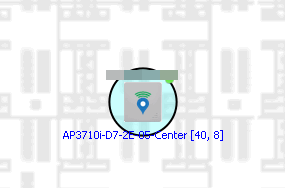
Drag the desired devices and APs onto the map area and position them to produce your network map. Be sure the APs are in the correct location, so your location and coverage maps are accurate. The center of the image is roughly the position of the AP. Be sure to place an AP on the correct side of a wall.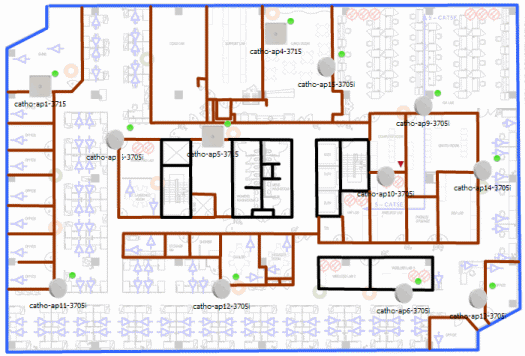
- Set AP orientation.
- Right-click on an AP in the map and select Set AP Orientation.
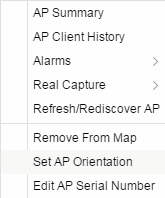
- Select the Vertical Orientation tab to set whether the AP is on the ceiling or wall.
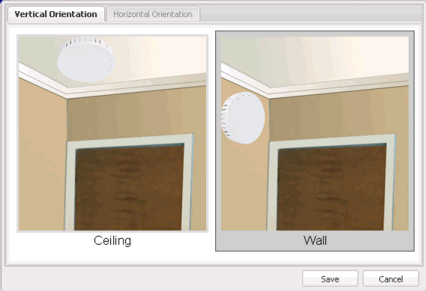
- If the AP is on a wall, the Horizontal Orientation tab appears and allows you to select the approximate direction the AP is facing.
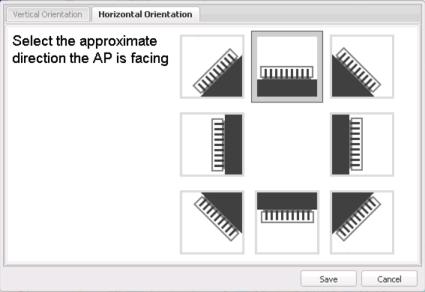
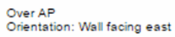
- Select Save to close the window. TIP: You can view AP orientation information by mousing over an AP. The AP orientation (if set) is displayed in the bottom right corner of the main map view.
- Right-click on an AP in the map and select Set AP Orientation.
- Select Save to save the map. The floorplan is uploaded to the controllers that manage the access points placed on the map. The map is now ready to display wireless location and coverage information. See the sections on wireless location and wireless coverage.
- Select the desired map view mode. When viewing a map, use the View drop-down list to specify whether to:
- Display markers instead of device images on your map
- Display cells on the map image to show the map's actual image area
- Display AP channel information (if available)
- Display walls and drawings
- Show application data for map links (if available)
- Set the map's background opacity
- Set the minimum location confidence to filter location confidence colors in triangulated location search results
Drawing Tools
The drawing tools allow you to add lines and shapes to your custom floorplans. The following table includes descriptions of the various drawing tools accessed from the Tool menu.
| Drawing Tool | Definition |
|---|---|

|
Select Items
Select a line or shape to select it for dragging or modification. Use the yellow drag handle to reposition the item; use the blue vertex to modify the shape. Select anywhere on the map and drag to reposition the map image. |

|
Draw Area
Location areas allow you to set policies for clients based on their location on a map. Position your cursor where you want to start drawing an area location. Select and draw the first line of the polygon. Select at each corner of the area location. To open the Configure Area window with the Draw Area tool active, double-click the area line. To open the Configure Area window and close the Draw Area tool, right-click the area line. |
|
|
Draw Polygon
Position your cursor where you want to start drawing the polygon shape. Select and draw the first line of the polygon. Select each corner of the polygon. Double-click to release the polygon line. When you are finished drawing, right-click to release the draw polygon tool. |

|
Draw Rectangle
Position the cursor where you want the rectangle. Select and drag to draw the rectangle. When you are finished drawing, right-click to release the draw rectangle tool. |

|
Add Text
Select the map to open the Enter Text window. When you are finished entering your text, select OK. Position the cursor where you want to place the text and select to add the text to your map. Use the Style menu to change the text appearance. |

|
Draw Triangle
Position the cursor where you want the triangle. Select and drag to draw the triangle. When you are finished drawing, right-click to release the draw triangle tool. |

|
Draw Line
Position your cursor where you want to start drawing the line. Select and draw the line. Select to change line direction. While drawing, press the Delete key to delete the last vertex in the line. Double-click to release the line. When you are finished drawing, right-click to release the draw line tool. |

|
Rotate Shape Select the shape you want to rotate. Use the blue handle to rotate the shape to the desired position. (You can also right-click on an image and select Rotate Shape from the menu.) |

|
Set Scale Opens the Set Map Scale window from which you can determine the scale of your map. |
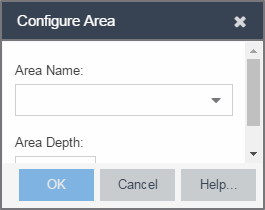
Configure Area Window
The Configure Area window, accessible from the Draw Area tool, allows you to name and determine the depth of an area.
- Area Name — The name of the area you are creating.
- Depth — A unique identifier for the area used when two areas overlap. In the event a client is located in a location shared by two areas, the client displays in the area with the higher Depth value.
| NOTE: | The Depth must be a value of 10 or higher. Values of 1 - 9 are reserved by the system. |
Area locations allow you to define up to 16 specific areas per floor on your map to determine whether a client position is inside or outside of each area. Additionally, you can create areas located inside of other areas. A client can only be located in one area at a time and based on the area in which the client is located, you can apply different policies to the client. For example, a client accessing the network from an area located in a classroom may be granted different access than a client accessing the network in an area located in a professor's office.
Style Menu
Use the Style menu to define the characteristics of the walls and other shapes you add to your custom floorplans. Following are definitions of the Style menu options.
| Style Option | Description |
|---|---|
| Font Color | Specify the color of the text added to the map. |
| Font Size | Specify the size of the text added to the map. |
| Line Thickness | Specify the thickness of the shape border in pixels. |
| Line Color | Specify the color used in shape borders. |
| Line Opacity | Specify the opacity of the shape borders. This allows you to shade the floorplan. |
| Shape Filled | Select the checkbox to fill shapes with the specified shape color. |
| Shape Color | Select the color used to fill the shapes you create. |
| Shape Opacity | Specify the opacity of the shape color. |
Wireless Client Location
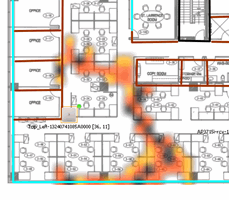
The wireless location feature requires you enable the location engine on the wireless controller. After you add APs to your custom floorplan and save the map, a copy of the floorplan is sent to each controller. The location engine incorporates information defined in the floorplan data and signal information from a client's contact with APs in order to calculate a client's precise location in the covered area. Client information from within a short time frame must be reported by at least three APs in order to determine a client's triangulated location.
To search for a wireless client, enter a MAC address, IP address, hostname, or user name in the map Search box and press Enter. (The client must be connected to an AP added to a map.)
The map containing the AP is displayed with an icon for the client. A colored distribution of location confidence is shown on the map with black being highest confidence, red medium confidence, and yellow lowest confidence. You can use the Min. Location Confidence slider on the View menu to filter out lower confidence colors. As you drag the slider, colors below the selected confidence level are no longer displayed. If you set the slider to the right-most point, only black is displayed.
Mouse over the client icon to see a tooltip with client information.
| NOTE: | The tooltip information is based on current data from the wireless domain unless the client icon displays a clock in the center. In that case, the tooltip information is based on historic data from the Wireless > Clients tab and the confidence colors are not displayed. |
If the location result is based on only one AP, the map displays probabilities for the location but with a few differences:
- No client icon is displayed.
- The location confidence distribution area is larger and generally displayed in a circular pattern.
- The associated AP is highlighted.
- The distance is shown beside the confidence legend at the foot of the map.
If there is insufficient data to provide triangulated results, the map displays the AP in the center, with a circle showing the possible area where the client may be located, based on the client's RSS (Received Signal Strength).
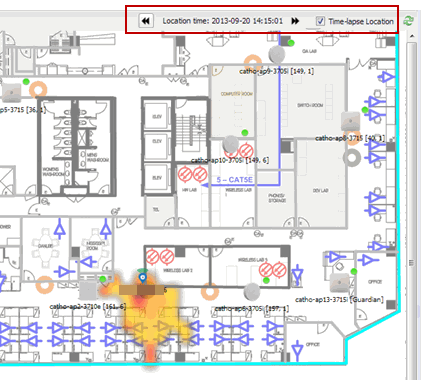
Time-Lapse Location
The wireless location feature provides the ability to view time-lapse location coverage for a client, using historic triangulated location results. This allows you to understand a wireless client's movement through the network and provides for better network troubleshooting.
When a current triangulated location search result displays, a checkbox is available in the upper right corner to enable time-lapse location.
When the checkbox is selected, a set of controls appears to the left of the checkbox, indicating the date of the displayed result. If there are historic events available, the Rewind arrow is enabled and you can scroll through the history. Note that for a historic location, the client icon displays a small clock inside it.
The Rewind and Fast-Forward arrows are disabled if there is no more history in that direction. After viewing historic locations, if you fast forward to the current location and it changed, the location updates.
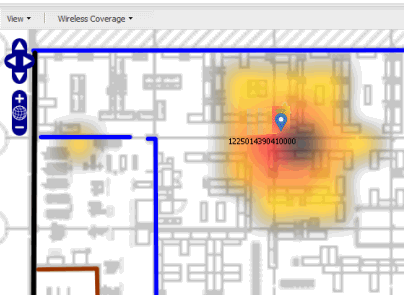
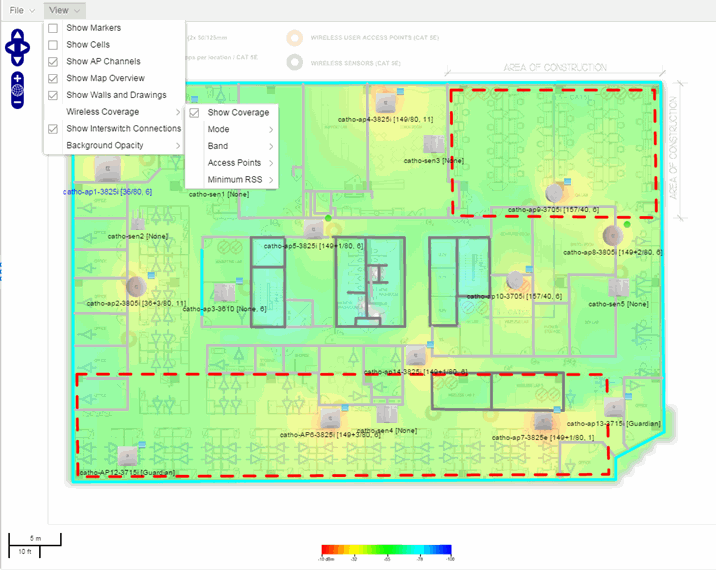
Wireless Coverage
After you finish your custom floorplan and saved the map, the map is ready to display wireless coverage information. Select View > Wireless Coverage > Show Coverage to show wireless coverage of the APs on the map and to enable the wireless coverage options. Use the View > Wireless Coverage menu available at the top of the map to select from the following coverage display options.
- Mode — Select from the different options for coverage display:
- Signal Strength— Use this mode to view AP signal strength. Set the Band, Access Points, and Minimum RSS options.
- Channel Coverage — Use this mode to view channel coverage and AP health. Set the Select Channel, Band, and Access Points options. This mode provides a graphical overview of channel allocation, helping to visualize radio management issues or locate potential interference.
- Data Rate — This mode shows a coverage map indicating the expected physical rate for all of the cells on the floor. Set the Minimum Physical Rate, Band, and Access Points options. Use this mode to ensure proper wireless performance throughout the network.
NOTE: Wireless coverage maps are divided into cells. Each cell displays a signal strength with which it is associated, used to determine wireless coverage and the location probability of a user. - Location Readiness — Use this mode to view the expected quality of location search results for each map cell, given the current placement of APs. Colors denote readiness for each cell:
- Green — Good readiness. There are four or more APs with visibility of the cell, with at least three of them within 20 meters.
- Yellow — Moderate readiness. There are three APs with visibility of the cell, with at least two within 20 meters.
- Orange — Poor readiness. There are less than three APs with visibility of the cell.
- Red — No triangulation. Only Cell of Origin location results are available in this area.
- Select Channel — Used to select the channels to view for Channel Coverage mode. If "All" is selected, each distinct channel is assigned a color as shown in the legend at the foot of the map, and the color brightness varies to indicate coverage intensity. Selecting a single channel shows a coverage map for that one channel's signal strength and displays a Channel Health window that shows the average and maximum utilization and noise levels for each applicable AP.
- Utilization — The percentage of busy time for the channel during the last 100 seconds. A channel is busy either because of an interference with energy above a threshold (-62dBm) or because of an active transmission of other stations or APs. This is an indicator of the congestion and interference on the channel.
- Noise — The noise floor measured by the AP on the 802.11 channel over the last 30 seconds. Noise floor is measured during the quiet time, between the valid transmission or reception of 802.11 frames.
- Min. Physical Rate — Used for Data Rate mode to set the minimum physical rate to display. A legend for the Physical Rate by color is visible at the bottom of the map.
- Band — Select the desired band (radio frequency).
- Access Points — Select which access points to include. These buttons allow you to select or deselect all APs. This option also contains a checkbox that allows you to use default values if a radio is off. When this checkbox is selected, you can view an estimate of coverage using default values; otherwise, no coverage is shown.
- Minimum RSS — Used to set the minimum RSS to display (default is -80) for Signal Strength mode. A legend for the RSS by color is visible at the bottom of the map.
When these options are set, the map displays the selected coverage information. The following map shows signal strength coverage.
Import and Export Maps
This section describes the map import and export functions. The map import function allows you to import exported maps into ExtremeCloud IQ Site Engine floorplan maps. The map export function exports floorplan maps to a ZIP file.
Importing Maps
The map import function gives you the ability to import maps into ExtremeCloud IQ Site Engine floorplan maps and gives you the ability to import floorplan maps are previously exported from ExtremeCloud IQ Site Engine maps.
When a map is imported, it is added as a child map of the World map. If the map's name is not unique, a number is appended to the end of the name. After the map is imported it can be moved and renamed, if desired.
To import a map:
- Launch ExtremeCloud IQ Site Engine and select the Network > Devices tab.
- In the left-panel, select Maps from the drop-down list.
- In the Groups/Maps navigation tree, right-click on the World map and select Maps > Import Map.
- The Import Map window opens. Use the Select File button to navigate to the map file to import.
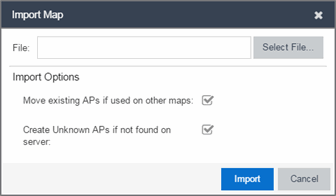
- Select the appropriate import options:
- Move existing APs if used on other maps — An AP can only be added to a single map. If you select this option and import an AP that already exists on another map, the AP is moved from the existing map to the imported map.
- Create Unknown APs if not found on server — If an AP is being imported that does not exist in ExtremeCloud IQ Site Engine, a placeholder AP is created. After the map is imported, you can edit the placeholder and map it to an existing AP not currently in use on another map. To do this, right-click on the placeholder and select Edit AP Serial Number.
- Select Import.
- The map is imported and positioned under the World map. It can be moved and renamed, if desired.
- Manually edit the exterior walls after the floorplan is imported.
- Select the map and select Edit to edit the map.
- Select the exterior wall and then select the Exterior checkbox. This designates the wall as an exterior wall.
- Select Save to save the map.
Exporting Maps
The map export function gives you the ability to export floorplan maps as a ZIP or SVG file.
To export a map:
- Launch ExtremeCloud IQ Site Engine and select the Network tab.
- In the left-panel Maps navigation tree, select the map you want to export.
- The map opens in Edit mode. Select File > Export Map as ZIP or Export Map as SVG.
- If you select Export Map as ZIP, the map is saved in a ZIP file in your browsers default download location.
- If you select Export Map as SVG, the map opens in a new tab, allowing you to save the map in the desired location.
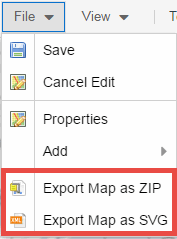
| NOTE: | The Export Map as ZIP option is only available for Floorplan map types. |
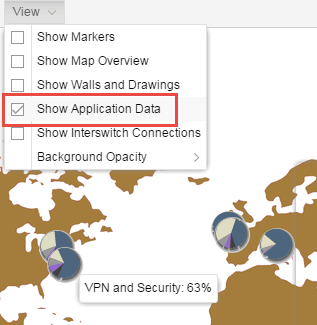
Show Application Data
You can display application data in maps by creating map links tied to ExtremeAnalytics network locations. Application data for the location tied to the link displays in the map.
When the Show Application Data checkbox in the View menu is selected, a pie chart is generated for every map link on the current map. The application data in the pie chart is based on the Site field specified for the link and corresponds to a site defined in the Site tab.
The pie chart displays the top five application groups (by bytes transferred) for the location specified for the map link. Rest the cursor over the pie chart to view a tooltip. If there is no application data, nothing displays.
Adding a Map Link with Location
- In the Maps navigation tree, right-click on the map you want to link from and select Maps > Edit Map or select File > Edit in the map properties panel.
- The map's property panel opens in Edit mode. Select File > Add > Map Link.
- The Add Link to Map window opens.
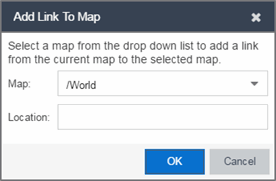
- From the drop-down list, select the map to which you want to link.
- Enter a site and select OK
- The map link is added to the map. You can reposition the map, if desired, or edit a link by right-clicking on the link (in Edit mode) and selecting Edit Link from the menu.
- Select the Save button to save the map.
| NOTE: | You can edit a map link created before link locations were supported by right-clicking on the link (in Edit mode) and selecting Edit Link from the menu. This allows you to specify a location for a link without having to delete and re-add the link. |
Wireless Map Limits
The following sections provide information about limits for wireless client location and wireless coverage maps.
Active Client Tracking
The number of active clients the location engine on the wireless controller can track simultaneously depends on the wireless controller model. Refer to your wireless controller documentation for information.
Maximum Number of Maps
A wireless controller on which version 10.01.01 or higher is installed can store a maximum of 200 maps. Wireless controllers running a version lower than 10 can store a maximum of 100 maps.
Maximum Number of APs per floorplan
A single floorplan allows a maximum of 2,000 APs when version 10.01.01 is installed on the wireless controller. A floorplan with a wireless controller on which a version lower than 10 is installed allows 100 APs.
For information on related help topics: