The Devices Impacted by Highly Utilized Ports report detailed information about the ports for which utilization statistics are above the threshold you configure. A port is displayed in the report if the port is up and historical data collection has been enabled on the device long enough for statistic collection.
| NOTE: | Use the Port Capacity Chart section of the Impact Analysis options to configure the threshold ExtremeCloud IQ Site Engine uses to determine port utilization. |
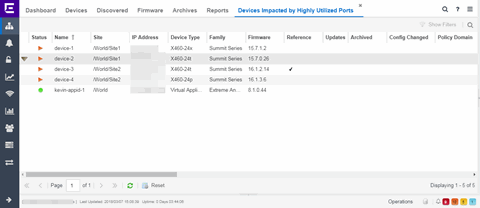
The following columns are included in the report:
- Device Status
- This column, hidden by default, indicates whether there is contact with the device. The color of the circle indicates the degree to which the device is communicating:
- Green icon (
 ) — Indicates ExtremeCloud IQ Site Engine is in contact with the device.
 - Yellow icon (
 ) — Indicates ExtremeCloud IQ Site Engine has issues contacting the device.
 - Red icon (
 ) — Indicates ExtremeCloud IQ Site Engine can not contact the device.
Hover over the Device Status icon to view additional details about the status for that device. - Green icon (
- Status
- Indicates the device/alarm status for the device. The icon indicates the severity of the most severe alarm on the device:
- Red icon (
 ) — A critical problem with significant implications.
 - Orange icon (
 ) — An error with limited implications.
 - Yellow icon (
 ) — A warning that might lead to a problem.
 - Blue icon (
 ) — Information only; not a problem.
 - Green icon (
 ) — ExtremeCloud IQ Site Engine can contact the device.
Hover over the status icon to view the number of alarms. Select on the alarm/device status icon to open a new page with detailed information about the alarms for that device. - Red icon (
- Device ID
- This column, hidden by default, displays a number that serves as a database identifier automatically created for the device. This number increments as you add additional devices.
- Name
- The device name, nickname, or IP address.
- Site
- The site in which the device is located.
- Poll Type
- This column, hidden by default, indicates the poll type ExtremeCloud IQ Site Engine uses to discover devices: SNMP, Ping or Not Polled.
- Poll Group Name
- This column, hidden by default, indicates the name of the Poll Group you define in the Poll Groups section of the Status Polling options.
- Admin Profile
- This column, hidden by default, indicates the access Profile that gives ExtremeCloud IQ Site Engine administrative access to the device.
- Client Profile
- This column, hidden by default, indicates the access Profile that gives ExtremeCloud IQ Site Engine client access to the device.
- IP Address
- The device's IP address.
- Context
- The Context column, hidden by default, displays a string that indicates how the device behaves, depending on whether the device is a router or a switch.
- IP Context
- The IP Context column, hidden by default, displays a device's IP address with the context appended to the end of the address following a colon.
- Trap Status
- Indicates whether a trap receiver is configured, not configured, or not supported for the device. This column is hidden by default.
- Syslog Status
- Indicates whether the device is configured to send information to the syslog or if it is not supported for the device. This column is hidden by default.
- Display Name
- The IP address of the device. This column is hidden by default.
- Device Type
- The type of device.
- Family
- The device product family.
- Firmware
- The revision for the firmware running in the device.
- Running Reference Firmware
- Indicates if the device's thresholds have been configured for Reference Firmware
- Updates
- The firmware release status for the device according to the results from the latest Check for Firmware Updates operation. Place your cursor on the column to see a tooltip describing the status.
- Archived
- Indicates if the device has been archived in the last 30 days.
- Config Changed
- Indicates if the archived configuration for the device has changed in the last 30 days.
- Policy Domain
- The policy domain assigned to the device.
- Boot PROM
- The revision for the BootPROM installed on the device.
- Base MAC
- The base MAC address for the device.
- Serial Number
- The serial number for the device.
- Stats
- Displays whether statistics collection is enabled or disabled on the device. A black check mark indicates that historical collection is enabled, a blue check mark indicates that threshold alarms collection (formerly monitor collection) is enabled.
- Location
- The physical location of the device. You can set the location for one or more devices by selecting the devices in the table, right-clicking, and selecting Set Selected Location from the menu.
- Contact
- The name of the responsible contact person. You can set the contact for one or more devices by selecting the devices in the table, right-clicking, and selecting Set Selected Contact from the menu.
- System Name
- Hostname for the device taken from the System Name field on the Device tab of the Configure Device window. You can set the system name for a device by selecting the device in the table, right-clicking, and selecting Device > Configure Device.
- Uptime
- The amount of time, in a days hh:mm:ss format, that the device has been running since the last start-up.
- Nickname
- The user-defined nickname for the selected device.
- Description
- A description of the unavailable device.
- User Data 1-4, Notes
- These columns can provide additional information about the device.
- Asset Tag
- A unique asset number assigned to the module or component for inventory tracking purposes.
For information on related help topics: