When you create an Advanced Browser report in the ExtremeAnalytics Browser, you can save it to the Report Designer to use as a custom component. The custom component uses the target, statistic, start time, and search criteria you defined in the Advanced Browser report.
Custom components are listed in the My Components section in the left-panel of the Report Designer. They are available for selection from the Component drop-down list in the Applications Browser section when you customize a system report or create a new report.
Create a New Component
You can create new components from the Reports > Custom Reports tab.
The left-panel options allow you to choose the category and duration of the data captured in the component. You can also choose the target for which the data will be displayed, and which statistical data will be displayed.
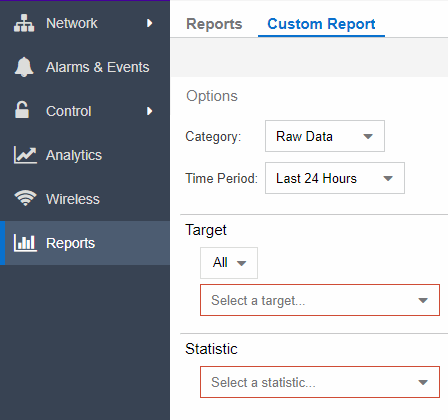
- Select a Category from the drop-down list. Options include Raw Data, Hourly, Daily, Weekly, and Monthly.
- Choose the Time Period for the data to be displayed. Options include Last 24 Hours, Yesterday, Last 3 Days, Last Week, Last 2 Weeks, Last Month, Last 3 Months, Last 6 Months, Last Year, or Custom. If you select a custom time period, you can choose your start and end times for the duration of the data.
- Select the Target type from the drop-down list. Then select the specific target from the Select a target drop-down list.
- Select the Statistic you want to display from the drop-down list.
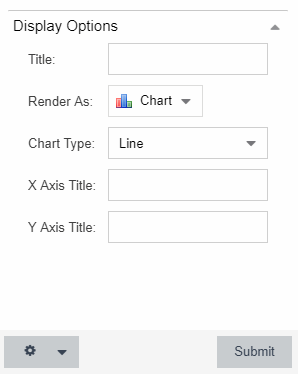
- Enter your Display Options to design your chart. You can choose to render the data as a chart or grid.
- Select Submit.
- Select the Gear button (
 ) in the bottom left corner and choose from the drop-down list:
 - (
 ) Save to Report Designer - If you choose this option, you can use the component in a new or custom report.
 - (
 ) Export to CSV
 - (
 ) Bookmark
 - Enter a name for your component.
For information on related help topics:
For information on related topics: