Use the ExtremeCloud IQ Site Engine > Reports tab to view historical and real-time reporting, including high-level network summary information and detailed reports and drill-downs.
The ExtremeCloud IQ Site Engine > Reports tab includes three tabs:
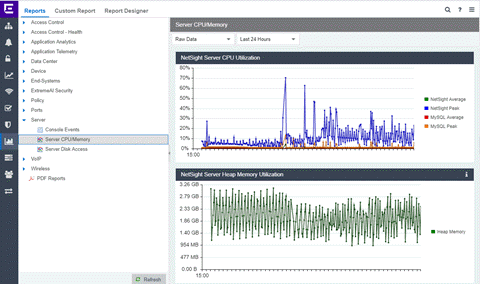
- Reports tab — Select from the left-panel catalog of reports, many of which are interactive and are adjustable for data and time on which to report.
Many include additional report features and functionality. Use the Info button
 at the top-right of the tab to access detailed information about many of the reports.
 - Custom Report tab — Create your own custom report by selecting a specific target type (such as Interface, Wireless AP, or Identity and Access end-system) and a statistic based on the selected target. Use the display options to show the report as a table or a chart, specify a chart type (column or line), add table titles and chart/axis titles, and assign custom colors to data series inside a chart. Select the Info button at the top-right of the tab to access detailed information about custom report options.
- Report Designer tab — Create a custom dashboard report, which is accessible from the Reports tab.
Additionally, use the Menu icon (![]() ) at the top of the tab to access links to additional information about your version of ExtremeCloud IQ Site Engine.
) at the top of the tab to access links to additional information about your version of ExtremeCloud IQ Site Engine.
Requirements
To view all reports on the Reports tab, you must be a member of an authorization group assigned full read access capabilities to all of the ExtremeCloud IQ Site Engine tabs and reports.
To collect data in your ExtremeCloud IQ Site Engine reports, you must enable statistics and flow collection for your network devices, interfaces, and wireless clients. For instructions, see How to Enable Data Collection.
Custom Report
Use the Custom Report tab to help diagnose a target/statistic pair collection problem as well as view specific ranges of data for a known target. It is a historical report with fully selectable parameters including
targets, statistics, category, date range, and display options.
Choose the report target such as APs, controllers, or interfaces, as well as the
statistics to report on, time frames, and more. Display reports either as a chart
or table. You can bookmark the reports you create to view at a later
time or to allow you to share the report with others. Report data can also be exported to a file in CSV format. For more information, select the Info
button at the top-right of the Reports tab.
Report Designer
The Report Designer lets you create custom dashboard reports by selecting from a list of available ExtremeAnalytics, IAM, Console, and Wireless dashboards, and customizing report components to meet your specific needs.
Once a report is created, it is available from the Reports tab.
Report Features
ExtremeCloud IQ Site Engine reports include the following features (depending on the report selected):
- Hover Over for Info — Hover over a pie section to display the name of the segment, the percentage represented by the segment and the number of elements. For some reports, selecting on a pie section opens a filtered end-systems grid for more detailed information.
- Drill-down for Details — Link to summary reports containing more detailed information.
For example, in the Controller Summary report, selecting on a controller shows a
detailed report for that controller over time.
- Interactive Tables — Manipulate table data in several ways to customize the view for your own needs.
- Interactive Charts — Use data-point rollovers for quick information on chart data. For example, in the Controller Summary report, rolling over the value reported for Bandwidth provides additional bandwidth statistics over time.
- Sparkline Charts — View network trends in dense, succinct charts that present
report data in an easy to read, condensed format. This provides you with a quick way to catch
possible problem areas that you can investigate further. Rollover charts for additional
information.
- CSV Export
 —
Save report
data to a file in CSV format to provide report data in table form.
—
Save report
data to a file in CSV format to provide report data in table form.
For information on related help topics: