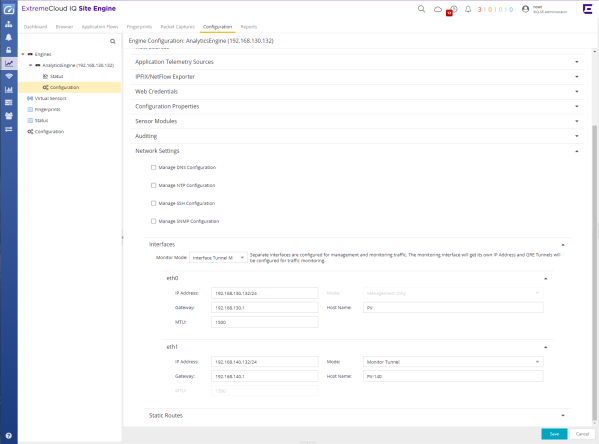
Use the Advanced Configuration panel to configure advanced options for the selected ExtremeAnalytics engine. To access this panel, select the Configuration view in the Analytics tab in the ExtremeCloud IQ Site Engine. In the left-panel tree, expand an engine and select Configuration.
If you make any changes in this window, be sure to select Save and then enforce the engine.
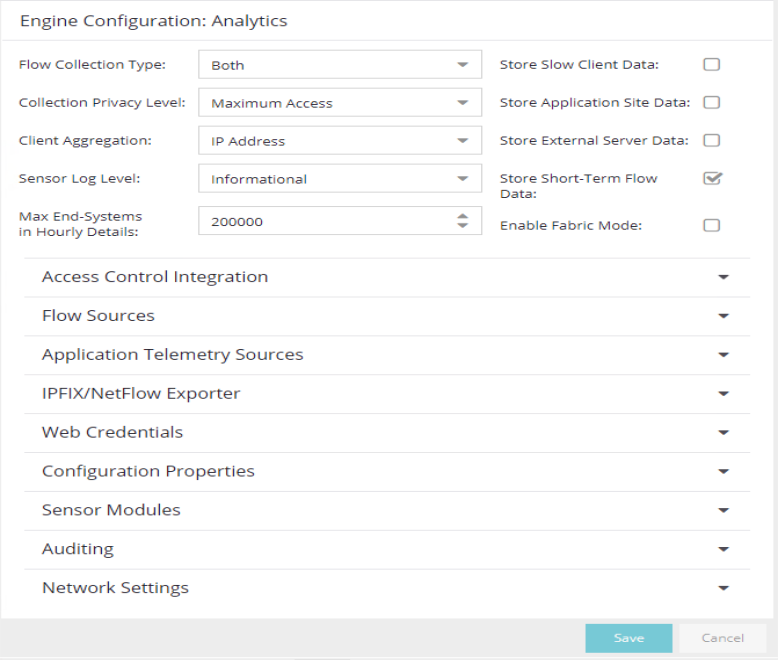
Flow Collection Type
Select from IPFIX/NetFlow, App Telemetry or Both from the drop-down list to choose the flow data you are using. Selecting SFlow changes the Flow Sources table to an Application Telemetry Sources table. These tables allow you to select the devices that collect application telemetry data flow by entering the name, IP and device family for that device.
| NOTE: | Changing an ExtremeAnalytics engine to Application Telemetry or Both does not update the configuration on the engine. Run the dnetconfig process on the engine to change the configuration. |
Collection Privacy Levels
Collection privacy level settings restrict the amount of identifying information collected by the ExtremeAnalytics engine and displayed in the Application Information column of the Application Flows report. (Access this report from the Analytics tab. In the Application Flows report, hover over the Application Information column to view the collected information.) This information is also displayed in the Flow Summary window.
Increasing the privacy level protects the end user's identifying information from being viewed by IT staff with access to the Application Flows report. The default privacy level allows maximum access to the information. Increasing the privacy level allows you to restrict the information that is collected and displayed.
There are three privacy levels. For all three levels, passwords are not collected or displayed.
- Maximum Access — The ExtremeAnalytics engine collects both identifying information and sensitive information. The information displays in the Application Information column.
- Medium Privacy — The ExtremeAnalytics engine collects identifying information, but not sensitive information. Identifying information displays in the Application Information column.
- Maximum Privacy — The ExtremeAnalytics engine does not collect identifying information or sensitive information. Information does not display in the Application Information column.
Identifying information is data that identifies the end user, such as a username. The ExtremeAnalytics engine collects identifying information when the privacy level is set to Maximum Access or Medium Privacy.
Sensitive information is data an end user may not want to share, such as the caller ID or contact information from an end user's SIP voice call. The ExtremeAnalytics engine collects sensitive information when the privacy level is set to Maximum Access.
Client Aggregation
Use this field to determine how client information is aggregated by the ExtremeAnalytics engine, either by IP Address or MAC Address.
Slow Client Data
Select Enabled in the drop-down list to collect additional information about clients with poor response times by the ExtremeAnalytics engine.
Max End-Systems in Hourly Details
Enter the maximum number of client end-systems stored in the ExtremeCloud IQ Site Engine database for the ExtremeAnalytics engine. This ensures your client limit is not collected from one engine. When the value set in this field is met, additional end-system data is not collected from the engine.
Sensor Log Levels
The ExtremeAnalytics sensor runs on the ExtremeAnalytics engine and inspects network traffic to identify applications and other information. The sensor log file records diagnostic information about sensor operations, which is useful for troubleshooting engine issues.
In the Configuration view, you can enable different levels of logging for the selected engine. Each logging level is inclusive of the levels above it. The five levels are:
- Informational
- Debug
- Verbose Debug
- Trace
- All
The sensor log level should be set to Informational unless you are troubleshooting an engine issue. When troubleshooting an issue, Extreme Networks Support may ask you to change the logging level to provide additional information.
To view the log file directly, log into the engine and navigate to the file /opt/appid/logs/appid.log.
You can also use the engine administration web page to view the sensor log. Access the web page using the following URL: https://<EngineIP or hostname>:8443/Admin. The default user name and password is "admin/Extreme@pp." When you have accessed the web page, navigate to the Log Files/Sensor Log page.
Store Application Site Data
Select this checkbox to allow the high-rate collector to store client count, flow count, bytes, received bytes, sent bytes, application response time, and network response time by application for a site. If this checkbox is selected, the Application/Site option is available as a Target in the Applications Browser when Data Table is Application Data - High-rate to display the information.
Access Control Integration
If your network configuration includes Access Control, Access Control data can be integrated with flow data to provide additional information. Access Control integration is only useful if you are collecting flows for end-systems managed by Access Control. For additional information, see Enabling ExtremeControl Integration.
- To enable Access Control Integration for the engine, select the Enable Access Control Integration checkbox.
- If your Access Control engines are using Communication Channels, select the Access Control Communication Channel option and enter the channel name. The ExtremeAnalytics engine is only able to access end-systems in its channel.
Flow Sources/Application Telemetry Sources
Use these sections to display the devices configured as flow sources or application telemetry sources in ExtremeAnalytics.
To add or remove a device as a flow source or an application telemetry source, see Adding and Removing Devices as Flow Sources Using the ExtremeAnalytics Advanced Configuration View.
Additional information about Application Telemetry ACL mirror definition
The definition of the ACL mirror is present in the file /usr/local/Extreme_Networks/NetSight/appdata/Purview/Fingerprints/telemetry.pol (if you are using the default installation directory).
The telemetry.pol file is transferred and activated in the telemetry source when you add Application Telemetry Sources.
-
On Switch Engine/EXOS: Application Telemetry uses the telemetry.pol and telemetryegress.pol files.
-
On Fabric Engine/VOSS: Application Telemetry uses the apptelemetry.pol or the sflow.pol file. The filter rules can exist in either file. The sflow.pol file is the default file and is included with the switch firmware image. This file contains the default filter rules. The apptelemetry.pol file is the user-defined file, which can be updated by the ExtremeCloud IQ Site Engine through script Factory script to update app-telemetry policy file.
| NOTES: |
What you need to know about the telemetry.pol file:
|
This is an example of custom addition to telemetry.pol.
entry smtp {
if match all {
    protocol tcp ;
    destination-port 25 ;
}
then {
    mirror EAN ;
    count smtpcnt ;
}
}- SMTP is a unique identifier
- Protocol and destination-port are traffic conditions.
- EAN is the name of the ACL mirror used by ExtremeAnalytics.
- SMTPCNT is the name of the ACL counter (configurable).
Web Credentials
Enter a new Username and Password for web service requests between the ExtremeCloud IQ Site Engine server and the ExtremeAnalytics engine. Select the Show Password checkbox to display the Password field unencrypted.
| NOTE: | By default, the Username and Password are admin and Extreme@pp, respectively. |
| NOTE: | The Web credentials are used to communicate between ExtremeCloud IQ Site Engine and ExtremeAnalytics Engine. If you use non-default credentials and add a new ExtremeAnalytics Engine, then you must pre-provision the new ExtremeAnalytics Engine with the new credentials manually by running /opt/appid/configWebCredentials <username> <password>. |
Configuration Properties
Use this section to add properties that provide a solution for a specific problem or task. These properties are supplied directly by Extreme Networks Support. Contact Extreme Networks Technical Support for guidance on using this section.
Sensor Modules
The ExtremeAnalytics sensor uses sensor modules to analyze different types of network traffic. For example, the HTTP decoder decodes HTTP traffic to acquire data needed to match fingerprints against that traffic.
In most cases, it is best to leave the decoders and detectors enabled. For better sensor performance, you can disable decoders for traffic rarely seen on the network; however, doing so prevents some fingerprints from triggering.
You can enable logging for any of the decoders and detectors for debugging purposes. As logging can impact disk space and performance, turn it on only for troubleshooting purposes. Do not enable logging during normal operation.
Auditing
Use this section to enable auditing of users connected to the ExtremeAnalytics engine CLI via SSH.
- Enable Auditing
- Selecting the Enable Auditing option enables the Auditing Rules field, where you can configure ExtremeCloud IQ Site Engine to store all commands entered by a user connected to the ExtremeAnalytics engine CLI via SSH in the engine's local syslog file.
- Auditing Rules
- Remove the # symbol from the beginning of a command line to enable the command and store user commands entered using the ExtremeAnalytics engine CLI.
Network Settings
Use the Network Settings section of the window to configure the network settings on an ExtremeAnalytics engine. Selecting a checkbox opens a new section from which you can configure the options for the setting. Select the Save button and the bottom of the panel to save your changes.
DNS
Select the Manage DNS Configuration checkbox to open the DNS Servers area. This allows you to enter a search domain or add or remove search domains and DNS server IP addresses.
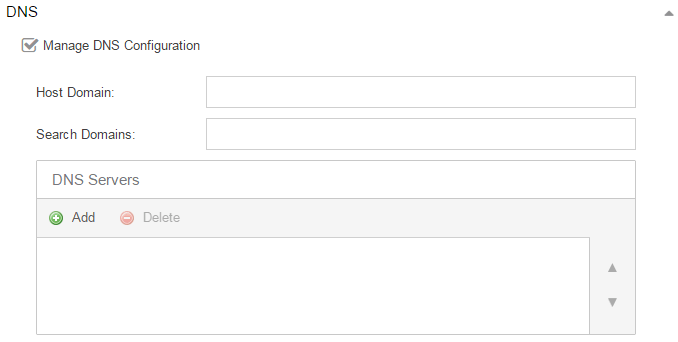
- Search Domains
- A list of search domains used by the ExtremeAnalytics engine when doing lookups by hostname. When an attempt to resolve a hostname is made, these domain suffixes are appended to the hostname of the device. For example, if someone does a ping to server1, ExtremeAnalytics appends the search domains in an attempt to resolve the name: server1.domain1 server1.domain2, and so on.
- DNS Servers
- A list of DNS servers the ExtremeAnalytics engine sends DNS lookups to for name resolution. The list is used by both hostname resolution and by the DNS proxy. Select the Add button to open a blank box in which you can enter an IP address. Select an IP address in the table and select the Delete button to remove an IP address. You can enter multiple servers for redundancy. Use the Up and Down arrows to list the servers in the order they should be used.
NTP
Select the Manage NTP Configuration checkbox to open the NTP (Network Time Protocol) Servers area. NTP configuration is important for protocols such as SNMPv3 and RFC3576 which incorporate playback protection. In addition, having accurate time configured on the ExtremeAnalytics engine is essential for event logging and troubleshooting.
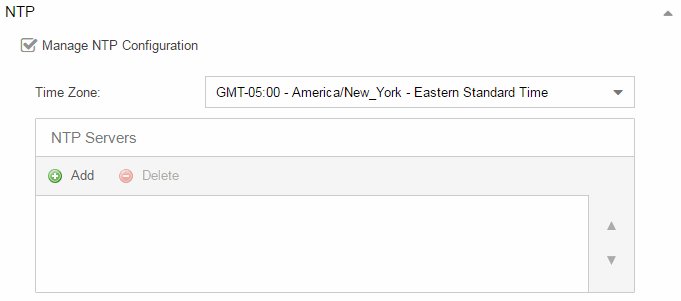
- Time Zone
- Select the appropriate Time Zone from the drop-down list to allow ExtremeAnalytics to manage date/time settings.
- NTP Servers
- A list of NTP servers. You can enter multiple servers for redundancy. Select the Add button to open a blank box in which you can enter an IP address. Select an IP address in the table and select the Delete button to remove an IP address. Use the Up and Down arrows to list the servers in the order they should be used.
SSH
Select the Manage SSH Configuration checkbox to open the SSH Users area. SSH configuration provides additional security features for the ExtremeAnalytics engine.
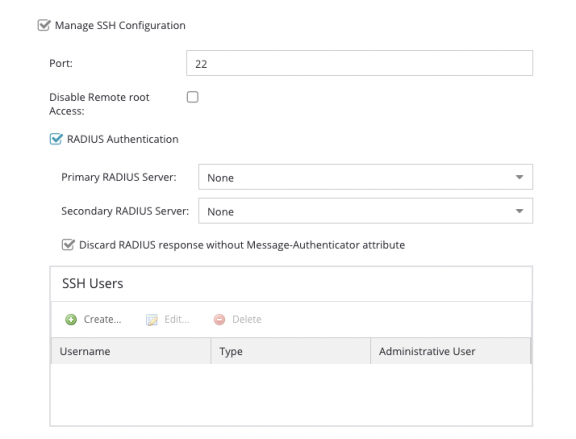
- Port
- The port field allows you to configure a custom port to be used when launching SSH to the engine. The standard default port number is 22.
- Disable Remote root Access
- Select this option to disable remote root access via SSH to the engine and force a user to first log in with a real user account and then su to root (or use sudo) to perform an action. When remote root access is allowed, there is no way to determine who is accessing the engine. With remote root access disabled, the /var/log/message file displays users who log in and su to root. The log messages looks like these two examples:
sshd[19735]: Accepted password for <username> from 10.20.30.40 port 36777 ssh2
su[19762]: + pts/2 <username>-root
Enabling this option does not disable root access via the console. Do not disable root access unless you have configured RADIUS authentication or this disables remote access to the ExtremeAnalytics engine. - RADIUS Authentication
- This option lets you specify a centralized RADIUS server to manage user login credentials for users that are authorized to log into the engine using SSH. Select a primary and backup RADIUS server to use, and use the table below to create a list of authorized RADIUS users.
For higher security, select the Discard RADIUS response without Message-Authenticator attribute. You must ensure the Primary and Secondary RADIUS servers are configured to include the Message-Authenticator attribute in every RADIUS packet. If selected, the RADIUS packets without Message-Authenticator attribute are dropped. - Authorized Users Table
- Use the toolbar buttons to create a list of users allowed to log in to the ExtremeAnalytics engine using SSH. You can add Local and RADIUS users and grant the user Administrative privileges, if appropriate. A user that is granted administrative rights can run sudo commands and commands that only a root user would be able to run. For example, some commands that require administrative rights to run would be:
sudo nacctl restart
sudo reboot
sudo nacdb
If a user is not granted administrative rights, they can log in, view files, and run some commands such a ping and ls.
SNMP
Use the SNMP configuration section to deploy SNMP credentials for the ExtremeAnalytics engine. The credentials can include different read/write credentials, for example, use "public" as the read credential and "private" as the write credential. In addition, basic host traps can be enabled from the ExtremeAnalytics engine. Select the Manage SNMP Configuration checkbox and provide the following SSH information.
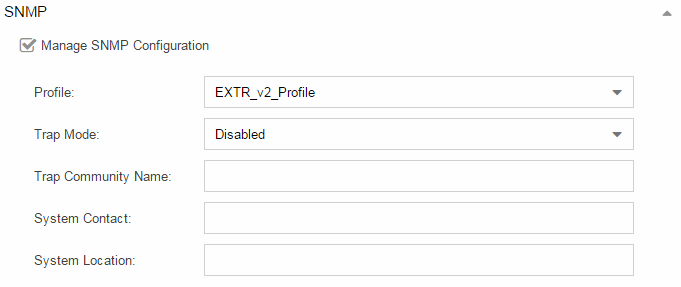
- Profile
- Use the drop-down list to select a device access profile to use for the ExtremeAnalytics engine.
Interfaces
Select a Monitor Mode from the drop-down list.
- Single ERSPAN
- A single interface is configured for management and ERSPAN traffic. Optionally you can apply Single ERSPAN Monitor Mode to another interface.
- Single Interface
- A single interface is configured for both management and monitoring traffic. A Generic Routing Encapsulation (GRE) Tunnel is configured for traffic monitoring.
- Dual Tap Mirror-N
- Separate interfaces are configured for management and monitoring traffic. The monitoring interface is put into tap mode for traffic monitoring.
- Dual Tunnel Mirror-N
- Separate interfaces are configured for management and monitoring traffic. The monitoring interface gets its own IP Address and GRE Tunnels are configured for traffic monitoring.
- Manual Mode
- The interface and tunneling configuration is not modified by this script. You can manually edit the configurations.
After you choose a Monitor Mode, at least one Ethernet port (typically eth0) must be configured. The Mode choices for Ethernet ports depend on the value of the Monitor Mode; eth0 defaults to either Management Only or Management and Monitor. If you have added any additional Ethernet ports, the available Mode options are also dependent on the Monitor Mode. The Modes are defined as follows:
- Management Only
- The mode is used for the communication with ExtremeCloud IQ Site Engine.
- Management and Monitor
- This mode is used for the communication with ExtremeCloud IQ Site Engine and the GRE Tunnels with flow/ telemetry sources.
- Monitor Tap
- The mode is used for raw data from the first N mirror.
- Disabled
- This mode is administratively down.
- Listen Only
- This mode is up and listens for the traffic.
- Monitor Tunnel
- This mode is used for GRE Tunnels with flow sources.
- Monitor ERSPAN
- This mode is used for listening for IPFIX, sFLOW, and ERSPAN from Flow/Telemetry sources.
| NOTE: | Configuration of network interfaces in ExtremeCloud IQ Site Engine is only available if the access profile contains the correct SNMP settings. Without SNMP communication, the list of interfaces does not display. |
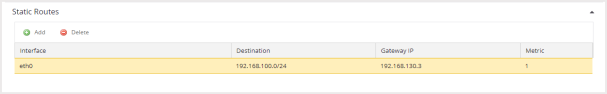
Static Routes
Static Routes defines additional static routes if the default route is not to be used for some destinations.
For information on related help topics:
![]()