Accessible from the Network tab, the Inventory Dashboard enables you to view the activity and status of the devices and ports that comprise your network.
The Inventory Dashboard includes three tabs:
Summary Tab
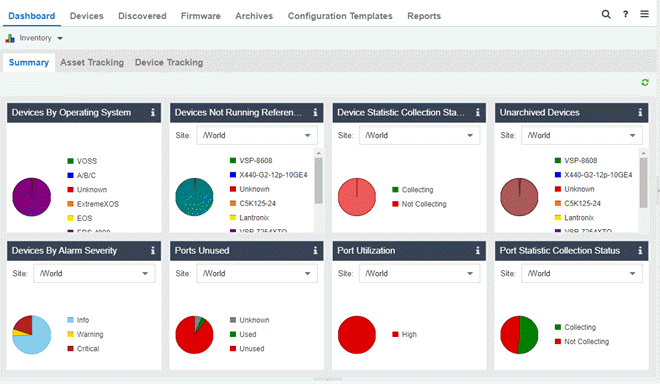
The Summary Tab displays pie charts and data that provide you with a snapshot view of the status of your network devices and ports, and ExtremeCloud IQ Site Engine's management of them. Select the Refresh button ( ) at the top right corner to manually update the charts.
- Devices By Operating System
- The Devices By Operating System chart categorizes devices by network operating systems.
Note: Devices included in the Unknown category in the pie chart may be devices that are added with a "Status Only" poll interval. Devices that do not have a Vendor Profile defined in ExtremeCloud IQ Site Engine, and devices that have a Vendor Profile, but the Network OS has not been defined, may also be included in the Unknown category.
If there are no devices at the World site, the chart displays the note: "No devices in /World."
-
- To display the name of the operating system, the number of devices using that operating system that are currently running, and the percentage of all devices that use that operating system, place the cursor over the operating system color in the pie chart.
- To open the Devices Using Operating System report, which displays detailed data about the devices using that operating system, select the operating system color in the pie chart.
- To remove a category and color from the pie chart, select it in the color legend to the right of the chart. Select it again in the legend to add it back to the chart.
- Devices By Alarm Severity
- Select a site from the Site drop-down list at the top of the Devices by Alarm Severity chart. The pie chart categorizes the devices, at that site, by the current alarms that they have.
Note: If no devices at the site you select are in alarm state, the chart displays the note: "No devices in this site have a current alarm." If the site has no devices, the chart displays the note: "No devices in site." -
The colors in the pie chart indicate the severity of the alarms:- Red — Critical — A problem with significant implications.
- Orange — Error — A problem with limited implications.
- Yellow — Warning — A condition that might lead to a problem.
- Blue — Info — Information only; not a problem.
- The Devices by Alarm Severity pie chart displays the number of devices having one or more alarms for each alarm severity.
- To display the number of devices that have alarms with an alarm severity, place the cursor over that alarm severity color in the pie chart.
Note: Devices in your network with no current alarms are not represented by a color in the pie chart. The number of devices found in each category does not add up to the number of devices in the network. - To open the Devices In Alarm report, which displays detailed data about the devices that have alarms with an alarm severity, select that alarm severity color in the pie chart.
- To remove a category and color from the pie chart, select it in the color legend to the right of the chart. Select it again in the legend to add it back to the chart.
- To display the number of devices that have alarms with an alarm severity, place the cursor over that alarm severity color in the pie chart.
- Devices Not Running Reference Firmware
- Select a site from the Site drop-down list at the top of the Devices Not Running Reference Firmware chart. The pie chart categorizes the devices, by device type, that currently are not running reference firmware.
Note: If no devices at the site you select are not running reference firmware, the chart displays the note: "No devices in this site are not running reference firmware." If the site has no devices, the chart displays the note: "No devices in site." -
- To display the device type name, the number of devices with that device type that are not running reference firmware, and the percentage of all devices not running reference firmware that are that device type, place the cursor over a device type color in the pie chart.
- To open the Devices Not Running Reference Firmware report, which displays detailed data about the devices that are not currently running reference firmware, select a device type color in the pie chart.
- To remove a category and color from the pie chart, select it in the color legend to the right of the chart. Select it again in the legend to add it back to the chart.
- Ports Unused
- Select a site from the Site drop-down list at the top of the Ports Unused chart. The pie chart categorizes the ports, at that site, that currently are and are not being used, or are unknown. The value of Used, Unused, and Unknown is determined by link status and accessibility; statistics collection is not factored into this determination.
Notes: - If ExtremeCloud IQ Site Engine cannot determine whether a port is used or unused because the device cannot be contacted or SNMP credentials are not successful, the port is included in the Unknown category.
- If no devices at the site you select have ports, the chart displays the note: "There are no devices with ports at this site."
- If the site has no devices, the chart displays the note: "No devices in site."
-
- To display the number of unknown ports or ports being used or unused, and the percentage of all ports that are unknown or being used or unused, place the cursor over a color in the pie chart.
- To open either the Ports Used or Ports Unused report, which display detailed data about the unknown ports or ports being used or unused, select a color in the pie chart.
- To remove a category and color from the pie chart, select it in the color legend to the right of the chart. Select it again in the legend to add it back to the chart.
- Device Statistic Collection Status
- Select a site from the Site drop-down list at the top of the Device Statistic Collection Status chart. The pie chart categorizes the devices, at that site, for which ExtremeCloud IQ Site Engine is currently collecting and not collecting statistics.
There are three settings for statistic collection: Historical, Threshold Alarms (formerly Monitor), and Disabled. In the pie chart, devices set to Historical and Threshold Alarms are included in the Collecting sections of the chart. Devices set to Disabled are included in the Not Collecting sections of the chart.- To display the number of devices collecting or not collecting statistics, and the percentage of all devices that are collecting or not collecting statistics, place the cursor over a color in the pie chart.
- To open either the Devices Collecting Statistics or Devices Not Collecting Statistics report, which displays detailed data about the devices collecting or not collecting statistics, select a color in the pie chart.
- To remove a category and color from the pie chart, select it in the color legend to the right of the chart. Select it again in the legend to add it back to the chart.
- Port Utilization
- Select a site from the Site drop-down list at the top of the Port Utilization chart. The pie chart categorizes the number of ports, at that site, with moderate or high utilization. Use the Administration > Options tab, and select Inventory in the left-panel, to set the thresholds for port utilization.
Port Utilization calculations require Port Statistic Collection to be enabled on the port for at least one hour so the hourly average can be used for the utilization calculation. Ports that do not have statistic collection enabled or that do not have a change in Octets received or sent will not be represented in this chart.Notes: The Port Utilization chart uses Octets from the SNMP MIB-II counters (for example, ifInOctets, ifOutOctets, ifHCInOctets and ifHCOutOctets) for the calculations. These MIB-II counters do not include the preamble, start of frame delimiter, or extension octets, which is different for these "Utilization" statistics, as compared to other tools or references which might include these additional parts of each packet in their calculations.
- If no devices at the site you select have high port utilization, the chart displays the note: "No devices in this site have high port utilization." If the site has no devices with ports, the chart displays the note: "There are no devices with ports, or no devices with ports with collection enabled in this site."
-
- To display the number of devices with ports with moderate or high utilization, and the percentage of with ports with moderate or high utilization, place the cursor over a color in the pie chart.
- To open the Port Utilization report, which displays detailed data about devices with ports with moderate or high utilization, select a color in the pie chart.
- To remove a category and color from the pie chart, select it in the color legend to the right of the chart. Select it again in the legend to add it back to the chart.
- Unarchived Devices
- Select a site from the Site drop-down list at the top of the Unarchived Devices chart. The pie chart categorizes the devices, by device type, that have not been archived in the last 30 days.
- To display the device type name, the number of devices with that device type that have not been archived in the last 30 days, and the percentage of the unarchived devices that have that device type, place the cursor over a device type color in the pie chart
- To open the Devices Unarchived report, which displays detailed data about the devices that have not been archived in the last 30 days, select a device type color in the pie chart.
- To remove a category and color from the pie chart, select it in the color legend to the right of the chart. Select it again in the legend to add it back to the chart.
- Port Statistic Collection Status
- Select a site from the Site drop-down list at the top of the Port Statistic Collection Status chart. The pie chart categorizes the ports, at that site, for which ExtremeCloud IQ Site Engine is currently collecting and not collecting statistics.
Note: If no devices at the site you select have port statistic collection enabled, the chart displays the note: "No devices with ports with collection enabled in this site." If the site has no devices with ports, the chart displays the note: "There are no devices with ports, or no devices with ports with collection enabled in this site." -
There are three settings for statistic collection: Historical, Threshold Alarms (formerly Monitor), and Disabled. In the pie chart, devices set to Historical and Threshold Alarms are included in the Collecting sections of the chart. Devices set to Disabled are included in the Not Collecting sections of the chart.- To display the number of ports collecting or not collecting statistics, and the percentage of the ports that are collecting or not collecting statistics, place the cursor over a color in the pie chart.
- To open either the Ports Collecting or Ports Not Collecting report, which displays detailed data about the ports that are collecting or not collecting statistics, select a color in the pie chart.
- To remove a category and color from the pie chart, select it in the color legend to the right of the chart. Select it again in the legend to add it back to the chart.
Asset Tracking Tab
The Asset Tracking tab displays asset and system details about the devices in your network.
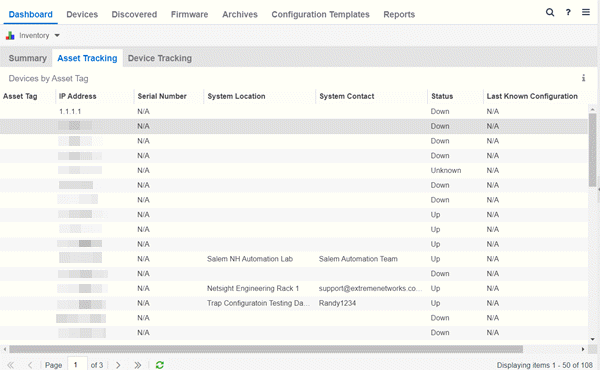
Select the Refresh button () at the bottom of the table to manually update the data in the table.
The Asset Tracking Table includes the following columns:
Device Tracking Tab
The Device Tracking tab displays details about Inventory Manager device activity. Use this tab to monitor changes made to devices in your network.
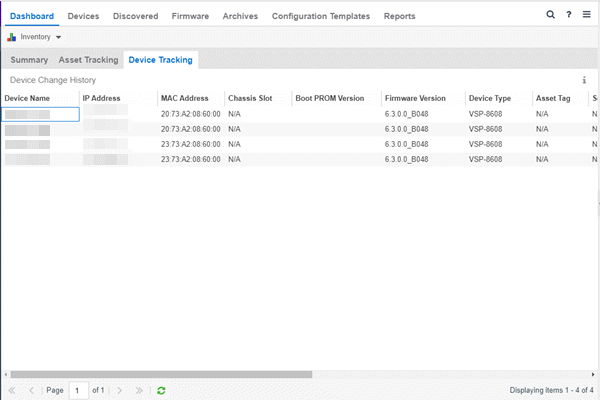
Select the Refresh button () at the bottom of the table to manually update the data in the table.
The Device Tracking Table entries are based on the devices' archival configuration files. The table includes the following columns:
- Device Name
- The name of the device, which you select when you configure the device for ExtremeCloud IQ Site Engine.
- MAC Address
- The MAC address for the device. MAC addresses can be displayed as a
full MAC address or with a MAC OUI (Organizational Unique Identifier)
prefix.
- Chassis Slot
- The slot number in the chassis where the device resides. N-Series devices
and devices that do not reside in a chassis display a value of N/A.
- Chassis ID
- The ID assigned to the chassis where the device resides (if applicable). This is usually a serial number or MAC address, depending on the chassis type.
For information on related help topics: