Selecting the Network tab displays details for the managed devices in ExtremeCloud IQ Site Engine, with sorting and filtering of relevant information for network troubleshooting.
Navigating the Network Tab
To access the Network tab, select it in the ExtremeCloud IQ Site Engine menu.
The Network tab provides access to the following sub-tabs:
- Dashboard — Presents a summary of ExtremeCloud IQ Site Engine data via a variety of dashboards, including the Impact Analysis, Overview, Multi Cloud, and Inventory dashboards.
- Devices — Provides you with information about the devices on your network and the relationships between devices. The Devices tab also allows you to organize devices into groups, geographically in maps, and configure default settings for newly discovered devices using sites.
- Discovered — Displays newly discovered devices on your network and allows you to configure those devices.
- Firmware — Allows you to view and upgrade firmware for network devices.
- Archives — Displays all device archives, or saved device configurations grouped by device type.
- Configuration Templates — Provides you with device configurations you can use as a template for your device types.
- Reports — Provides a variety of system reports that give information about your devices, ports, and network traffic.
Additionally, the Menu icon (![]() ) at the top of the screen provides links to additional information about your version of ExtremeCloud IQ Site Engine.
) at the top of the screen provides links to additional information about your version of ExtremeCloud IQ Site Engine.
Dashboard
Select the Dashboard tab to view graphical data about devices on your network.
The Dashboard contains four options, the Impact Analysis, Overview, Multi Cloud, and Inventory dashboards.
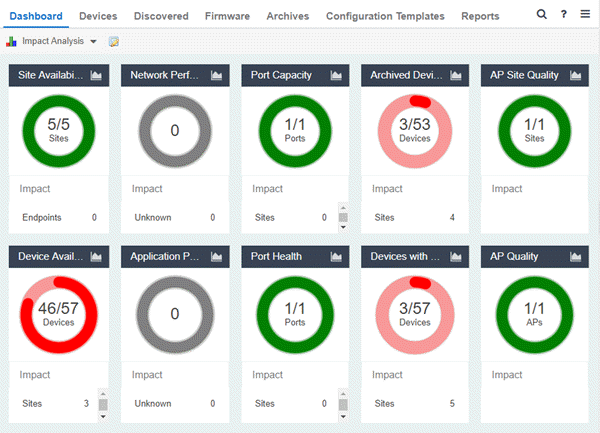
- Impact Analysis
- The Impact Analysis dashboard displays a real-time summary of Availability, Performance, Capacity/Health, and Configuration data for your network. The dashboard provides you with charts that identify the scope and scale of faulting elements in the network or location. Charts display an impact status and an impact summary for a particular factor that are updated automatically when conditions change.
- Overview
- The Overview dashboard displays several reports containing statistical information about the devices on your network. The information presents a sampling of the performance of individual devices.
- Multi Cloud
- The Multi Cloud dashboard provide an overview of all virtual machines on the network broken down into VM distribution per ExtremeControl profile, Operating System, Switch, and Hypervisor technology. It also provides detailed information on all VMs. For each supported Hypervisor technology, sub-reports provide more in-depth data. Additionally, the Multi Cloud dashboard includes information about Google Compute, Amazon Web Service, and Microsoft Azure instances.
- Inventory
- The Inventory Dashboard includes a Summary tab, which displays several pie charts that enable you to view the activity and status of the devices and ports that comprise your network. The criteria for each chart is configurable, and you can drill down from each chart to access reports displaying details about the device and port activity.
The Inventory Dashboard also includes Asset Tracking and Device Tracking tabs. Use these tables to monitor changes made to assets and devices in your network.
Devices
Select the Devices tab to display information about devices in your network and the maps and sites in which they are added.
Left-Panel Tree
The left-panel of the Devices tab contains a drop-down list, enabling you to view all of your devices, a subset of devices, your maps, or your sites.
Selecting a device, device group, map, or site in the Groups/Maps navigation tree displays details about that item in the right-panel. Additionally, you can contact the selected devices with the currently configured profile and execute CLI commands on devices or device groups.
Right-Panel Tabs
The information in the right-panel is organized into tabs. The tabs available depends on the item selected in the left-panel.
- Devices — The Devices tab contains a table of information about the devices selected in the left-panel (or the devices included in the map or site selected in the left-panel), including the status of the device, the IP address, the device type, the firmware version, and the serial number.
- Site — The Site tab allows you to create a default configuration for devices being added to the selected site.
- Summary — The Summary tab opens the Device View for the device selected.
- Map — The Map tab displays the geographic, topology, or floor plan map as well as a graphic representation of the devices contained in that map.
- Site Summary — The Site Summary tab contains a table of information about the sites on your network, including the path, addresses, and configuration.
- Endpoint Locations — The Endpoint Locations tab displays the geographic locations of your devices and sites.
- FlexReports — The FlexReports tab contains reports available for the device, controller, map, or site selected in the left-panel.
Discovered
Select the Discovered tab to view devices new to your network not yet added to the ExtremeCloud IQ Site Engine database. Devices appear on the Discovered tab when they are:
- Discovered via the Site tab and one of the following occurs:
- The Automatically Add Devices checkbox is not selected in the Site Actions section of the tab.
- The serial number of the device matches:
- The serial number of another device being discovered.
- The serial number of a device already in the ExtremeCloud IQ Site Engine database.
- The serial number is not defined for a device and the base MAC address matches:
- The base MAC address of another device being discovered.
- The base MAC address of a device already in the ExtremeCloud IQ Site Engine database.
- The serial number and base MAC address are not defined for a device and the IP address matches:
- The IP address of another device being discovered.
- The IP address of a device already in the ExtremeCloud IQ Site Engine database.
- The device uses a profile different than those associated with devices that already exist in the ExtremeCloud IQ Site Engine database.
- Discovered using the Pre-Register Device window for your ZTP+ (Zero Touch Provisioning Plus) enabled devices.
- Discovered using a trap to discover a ZTP (Zero Touch Provisioning) enabled device.
| NOTE: | ZTP+ functionality is supported on ExtremeXOS/Switch Engine devices on which version 21.1 (or greater) is installed, FastPath devices, Fabric Manager, ExtremeAnalytics engines, and Access Control engines. |
|---|
| NOTE: | ZTP functionality is not identical to ZTP+ functionality. |
|---|
Firmware
Select the Firmware tab to assign a firmware or boot PROM image to one or more product families or device types. This enables you to download the assigned image to any of your network devices of that family or type. Use the Details section of the tab to display the firmware or boot PROM image details and save the image to the device.
Archives
Select the Archives tab to create new archives for your devices and view a list of existing archives grouped by device type in the left-hand panel. This tab provides information about archive operations performed on the selected device or device group. Additionally, use your archives to compare your device configurations against industry best practices.
Configuration Templates
Select the Configuration Templates tab to view and use device configuration templates grouped by device type in the left-hand panel. This tab provides information about configurations you can use as templates for your devices.
Reports
Select the Reports tab to view information about the devices and ports on your network as well as information about network traffic. Available reports are accessible via the Reports drop-down list at the top of the tab and are grouped into the following three reporting areas:
- Device
- Interface
- Network
Select Information ( ) in the top-right corner of a report to view more information about that report.
Select Export to CSV ( ) to export the information contained in the report to your default CSV application, where it can then be manipulated or saved.
For information on related help topics:
For information on related topics:
For information on related tasks:
![]()