ExtremeCloud IQ Site Engine Reports provide historical and real-time reporting, offering high-level network summary information as well as detailed reports and drill-downs.
Select from a catalog of reports, many of which are interactive, allowing you
to adjust the data and time on which to report.
See below for a description of each report and a section on helpful report features and functionality. Use the Info button  at the top-right of the ExtremeCloud IQ Site Engine page to access detailed information about many of the reports.
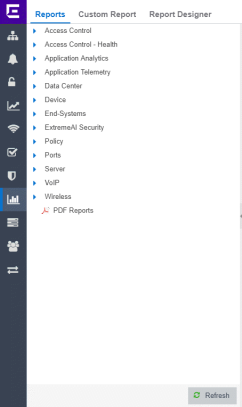
Reports Catalog
The Reports catalog lets you select a report from the following report types:
- Access Control — Provides an overview of end-system connection information. You can also see these reports and others on the Control tab.
- Access Control Health — Provides reports on end-system assessment and state information. In the Risk Level pie chart, select a pie section to open a filtered end-system grid for more detailed information about end-systems at that risk level.
- Application Analytics — These reports provide visibility into the applications on your network and who's using those applications.
- Application Telemetry — Provides reports on interfaces, clients, and applications.
- Data Center — These reports provide an overview of all virtual machines on the network broken down into VM distribution per ExtremeControl profile, Operating System, Switch, and Hypervisor technology. They also provide table reports with detailed information on all VMs. For each supported Hypervisor technology, sub-reports provide more in-depth data.
- Device — The Device reports provide information on device alarms, device archives (archive events and details), device availability, potential duplicate devices, down devices, port usage and details, devices removed from service, top devices by IP traffic, top hosts by resource (memory, CPU, and disk usage), top switches by power (percent usage and consumption in watts), and top switches by resource (CPU and physical memory).
- End-Systems — These reports present information on the end-systems connecting to your network.
- Network - Includes the Impact Analysis and Network Status Summary reports.
- Policy — Provides a Policy Rule Hit Summary report showing top services and roles by rule hits.
| NOTE: |
The Policy Rule Hit Summary report only supports legacy EOS devices, and requires manual configuration of the syslog receiver on UDP port 514. The best practice is to configure the device to only send Rule Hit syslog messages on port 8514 and other Syslog messages on the default port used for alarms. For EXOS/Switch Engine devices, you can use the ExtremeCloud IQ Site Engine Control > Policy > Devices & Port Groups > Device > Rule Hit Counts panel for displaying the hit counts when the domain is configured in ACL Rule mode. |
|---|
- Ports — Provides information about the most utilized ports on your network by bandwidth, flows, PoE usage, as well as those that are least available.
- Server — These reports provide data on the ExtremeCloud IQ Site Engine server, including the Event Log, CPU and heap memory utilization, and disk access information. The information in the Console Event Log report is the same as the Alarms and Events tab. For more information on using this report, see the "Alarms and Events" Help topic.
- VoIP — Provides a report about calls made via Skype for Business.
- Wireless — A collection of summary reports providing information on
your wireless network components, including reports for AP groups, APs, clients, controllers,
and mobility zones.
Wireless reports also provide data on wireless components ranked by bandwidth and clients, such as top APs by bandwidth, top clients by bandwidth, and top controllers by clients, as well as reports on APs and controllers that are down. In addition, the FloorPlans Summary report, which displays wireless information for selected ExtremeCloud IQ Site Engine floorplans, is included in the collection of summary reports.
For convenience, you can also view some of these reports from the Wireless tab. - PDF Reports — Generate summary reports of your current network configuration in PDF format including a Console Report, Network Status Summary, Inventory Report, Identity and Access Summary, and Wireless Configuration Report. You can save these reports or send them to other users in the organization.
For information on related help topics: