The Network Status Summary displays network and user activity reports for a selected site.
To access the summary reports, navigate to the Reports > Reports tab, expand the Network option in the Reports Catalog, and select Network Status Summary.

Select a site from the Site drop-down list. (The default site is the /World site.) The reports displayed on the right-panel tabs contain information about components from that site.
| NOTE: |
Select Refresh ( |
 ) to display newly added sites to the Site drop-down list.
Select a duration from the drop-down list to display report data on an Hourly, Daily, Weekly or Monthly basis.
The following tabs are included in the Network Status Summary right panel:
- General - Lists the Top 10 Least Available Devices and their percentage of availability.
- Device CPU and Physical Memory - Displays the following reports:
- Top 10 Devices by % CPU
- Top 10 Devices by % Physical Memory
- Ports and Device Disk Space - Displays the following reports:
- Top 10 Ports by % Utilization
- Top 10 Devices by % Disk Space
- Controllers and Access Points - Displays the following reports:
- Top 10 Controllers by Bandwidth
- Top 10 APs by Bandwidth
- Top 10 APs by Clients
- WLANs and Clients - Displays the following reports:
- Top 10 WLANs by Clients
- Top 10 Clients by Bandwidth
Network Status Summary PDF
You can also access a Network Status Summary PDF Report from the Reports > Reports tab.
Navigate to PDF Reports at the bottom of the left-panel tree and select Network Status Summary from the Console list in the right panel. The Network Status Summary PDF report graphs are not grouped in categories.

Network Status Summary Reports
The following reports are included in the Network Status Summary:
- Top 10 Least Available Devices
- Displays the top ten devices in your network that are least available.
- Top 10 Devices by % CPU
- Displays the top ten devices by the percentage of CPU utilization.
- Top 10 Devices by % Physical Memory
- Displays the top ten devices by percentage of physical memory used.
- Top 10 Ports by % Utilization
- Displays the top ten ports with the highest percentage of utilization.
- Top 10 Devices by % Disk Space
- Displays the top ten devices by the percentage of disk space used.
- Top 10 Controllers by Bandwidth
- Displays the top ten Wireless controllers with the highest controller bandwidth.
- Top 10 APs by Bandwidth
- Displays the top ten APs by the AP bandwidth.
- Top 10 AP by Clients
- Displays the top ten APs by the clients associated with those APs.
- Top 10 WLANs by Clients
- Displays the top ten WLANs by the clients associated with those WLANs.
- Top 10 Clients by Bandwidth
- Displays the top ten client MAC addresses by their client bandwidth.
NOTE: You must enable Client Statistics Collection for the Clients by Bandwidth report to display data. Enable Collect Client Statistics on the Administration > Options > Site Engine - Collector > Wireless Collection tab.
To enable Client Statistics Collection per Controller, navigate to the Network > Devices tab, and select a device from the table in the right panel. Right select the device and select More Actions > Collect Device Statistics. The Wireless Client Statistic Collection option is visible only when the Collect Client Statistics feature is enabled.
Schedule a Network Status Summary
You can schedule hourly, daily, weekly and monthly versions of the Network Status Summary using the Scheduled Tasks tab in ExtremeCloud IQ Site Engine.
To create a scheduled task:
- Navigate to the Tasks > Scheduled Tasks tab.
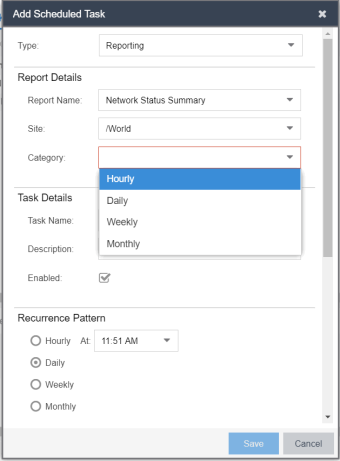
- Select the Add button. The Add ScheduledTasks window opens.
- Follow the steps to add a scheduled task to create a scheduled report. Select Network Status Summary from the Report Details drop-down list. You can also select the Site, from which the report data is collected, and the Category, which allows you to select the duration of the report data (Hourly, Daily, Weekly or Monthly).
- The Tasks > Scheduled Tasks tab displays the scheduled task table, which includes the Network Status Summary report task you created.

For information on related help topics:
For information on related ExtremeCloud IQ Site Engine topics: