Device View is an ExtremeCloud IQ Site Engine component that provides a wide range of analysis and troubleshooting information for your network wired and wireless devices, including a device summary, FlexViews, and ExtremeCloud IQ Site Engine reports.
The primary launch point for Device View is from the Network tab. Device View can also be launched from other locations in ExtremeCloud IQ Site Engine.
This Help topic provides the following Device View information:
Requirements
Access Requirements
Access to Device View reports is determined by the user's membership in an ExtremeCloud IQ Site Engine authorization group and the group's assigned capabilities. The following list shows the capabilities required for full access to all the Device View reports.
- XIQ-SE OneView > Access OneView
- XIQ-SE OneView > Access OneView Reports
- XIQ-SE OneView > Events and Alarms > OneView Event Log Access
- XIQ-SE OneView > FlexView > OneView FlexView Read Access
Data Collection Requirements
Device View reports require that historical data collection is enabled for the device. For information on configuring data collection, see Collect Device Statistics in the Devices section of the ExtremeCloud IQ Site Engine User Guide.
Device View Panels
The Device View is comprised of a left-panel device summary, and a selection of tabbed panels that display FlexViews and reports based on the device family.
Left-Panel Device Summary
The left-panel device summary view (shown below) is displayed in each Device View report.
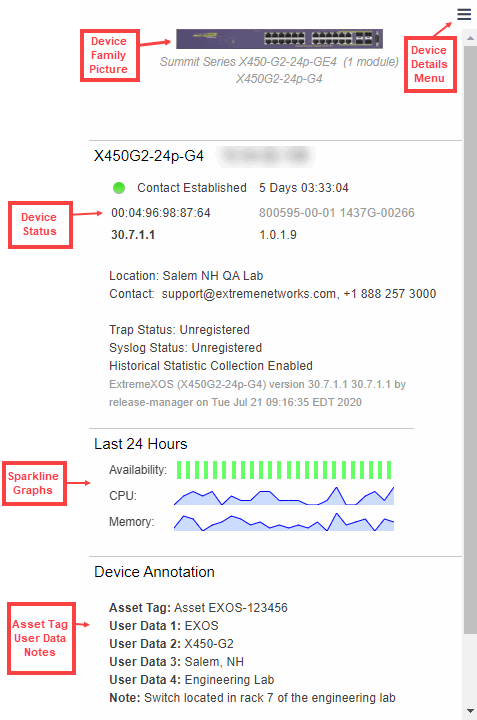
Each device summary view includes:
- Device Family Picture — A generic device family picture for the device.
- Device Status — Indicates the alarm/device status for the device. The icon color indicates the severity of the most severe alarm on the device. A red icon indicates a critical alarm or the device is down. A green icon indicates that there are no alarms and the device is up.
- Sparkline Graphs — Provides network trends in dense, succinct charts that present report data in an easy to read, condensed format. You must have Historical Statistic Collection enabled in order to see the Sparkline graphs and other report data. If Historical Statistic Collection is not enabled, you will see a line that says, "Historical Statistic Collection Disabled." For information on configuring data collection, see Collect Device Statistics in the Devices section of the ExtremeCloud IQ Site Engine User Guide.
- Asset Tag, User Data, Notes - Displays the Asset Tag, User Data and notes about the device. This data is only displayed if you have configured these values in ExtremeCloud IQ Site Engine.
- Firmware Updates Available — If there are new firmware releases available for the device (based on the results from the
latest Check for Firmware Updates operation), the Firmware Update icon
 displays. Right-click on the icon to open
a window listing the current available firmware releases with links to download
the firmware.
displays. Right-click on the icon to open
a window listing the current available firmware releases with links to download
the firmware. - Device Details Menu — Select the Menu icon (
 ) in the upper right corner to access additional device reports.
Right-Panel Device Summary
The following tabs and reports are available in the Device View. The reports displayed in a Device View vary according to the selected device. For most reports, right-click a device in the table to export the table details or details about the selected device to a .csv report.
 Refreshes the status of all ports.
 Rediscovers all the device data.
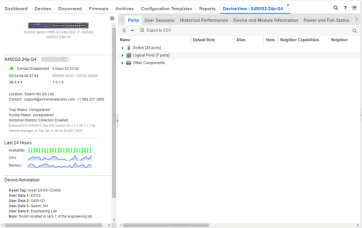
Use the Ports report to view details about the ports and other components associated with the Device Family. The following columns are included in the Ports report:
- Name - The name assigned to the port
- Default Role - The policy role assigned to the selected port.
- Alias - An alternate name for the port.
- Stats - Displays whether statistics collection is enabled or disabled on the port. A black check indicates that historical collection is enabled, and a blue check indicates that threshold alarms collection (formerly monitor collection) is enabled.
- Neighbor Capabilities - Displays capabilities for neighbor ports.
- Neighbor - Displays neighbor details from CDP/EDP/LLDP. Place your mouse over the column to see the protocol type.
- Port Speed - Displays the speed of the port
- PVID - The port's VLAN ID.
- VLANs - Displays the name of the VLAN.
- Description - A description of the port.
- Port Type Details - Displays the port type and other information about the port type.
- Serial Number - Displays the port's serial number.
- Select an entry in the table, expand to display a port, and right-click to open the following drop-down list:
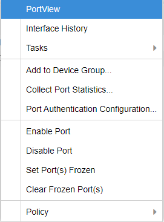
- PortView - Access PortView for that port.
- Interface History - view interface history including interface utilization, availability, and bandwidth/packets/flows statistics (Flow stats display only for S/K series and PF-FC-180 devices).
- Add to Device Group - Use to select a Device Group to which you will add the port.
NOTES: Right-clicking ports and selecting Add to Device Group opens the Add to Device Group window, which allows you to select a device group to which to add the selected ports.
Right-click a port and select the Application Telemetry menu to view the Interface Top Applications Treemap or Top Clients by Interface report for the port. If Application Telemetry is not enabled on the device, the Application Telemetry menu does not display.
Only VLANs to which ports are assigned are displayed in this report. Additionally, VLAN reports for ExtremeXOS/Switch Engine devices may display duplicate VLANs as VLANs are assigned by slot.
- Collect Port Statistics - Opens a window from which you can select your statistics collection mode (Historical, Threshold Alarms), or disable statistics collection.
- In Historical mode, port statistics are saved to the database and aggregated over time, for use in reports. The statistics are also used for threshold alarms configured in the Console Alarms Manager. In the Active Threshold Alarm Summary box, you can see all active threshold alarms configured in the Console Alarms Manager that use these statistics.
- In Threshold Alarms (formerly Monitor) mode, port statistics are saved for one hour and then dropped. You can use these statistics for threshold alarms, but not for ExtremeCloud IQ Site Engine reporting. In the Active Threshold Alarm Summary box, you can see all active threshold alarms configured in the Alarms and Events tab that use these statistics. (Note that you do not see the Threshold Alarms mode option if you have disabled threshold alarms collection in the OneView Collector Advanced Settings in Administration > Options.)
- Disable — Select this check box to disable statistic collection mode.
- Port Authentication Configuration - Access the Authentication Configuration for the port.
- Enable Port - Enables the port for the device.
- Disable Port - Disables the port for the device.
- Set Port(s) Frozen - Select to freeze the selected port.
- Clear Frozen Port(s) - Select to clear the selected frozen port.
- Policy - Use to create policy profiles, called roles, that are assigned
to the ports in your network.
NOTE: Enabling Historical Statistics Collection may use substantial disk space.
- MAC Addresses
- Device Logs
- Alarms
- Events
- Archives
- User Sessions
- Historical Performance
- Switch Resources
- Device and Module Information
- Controller History
- Power and Fan Status
- Active Access Points
- Storage Utilization
- Process Utilization
- WLAN Services
- CPU and Process Utilization
- VLAN
- Active Clients
- IP Traffic Summary
- MLAG
- Alarms and Events
- VPLS
Launching Device View
Device View can be launched from a variety of locations in ExtremeCloud IQ Site Engine.
Network Tab
The primary launch point for Device View is from the Network tab.
- Open the Network > Devices tab.
- Place your mouse over the first column and select the Device View icon
 .
. - The Device View opens as a separate tab.
Control Tab
Use the following steps to launch Device View from the Control tab.
- Open the Control > Dashboard tab.
- Select the System view.
- In the Engine Information report, select an engine IP address to open a Device View for the engine.
ExtremeCloud IQ Site Engine Maps
Use the following steps to launch Device View from a map.
- Open ExtremeCloud IQ Site Engine Maps and select a map.
- In the map, right-click on a device icon and select Device View.
Search
Use the following steps to launch Device View from the Search tab.
- Open Search and search for a device.
- In the Overview, right-click on the device icon and select Device View.