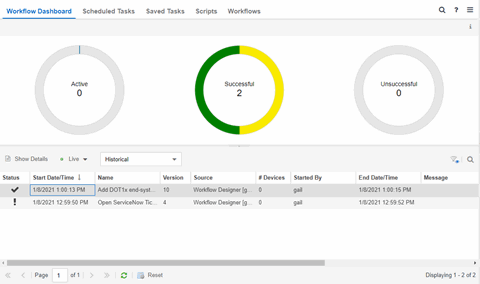
The Workflow Dashboard tab allows you to view information about workflows you execute on devices in your network.
The tab contains two sections:
Additionally, double-clicking a workflow in the Workflow Results table opens the Workflow Details tab.
Workflow Charts
The top of the Workflow Dashboard tab displays three charts that provide a summary of Active Workflows, Successful Workflows, and Unsuccessful Workflows. If the Update drop-down list above the Workflow Results table is either Live or Live (Current Page), the information in these charts updates automatically as conditions change.
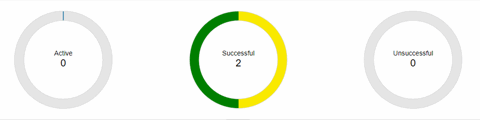
The center of each chart indicates the number of active, completed, and failed workflows. Each chart includes multiple Statuses. Hover over a ring color to display a description of the Status for that piece of the chart. Select a section of one of the ring charts to filter the Workflow Results table to display the workflows with a Status that matches the color selected.
- Active
- The center of the Active Workflow ring chart indicates the number of workflows currently running in ExtremeCloud IQ Site Engine.
- Successful
- The center of the Successful ring chart indicates the number of workflows that completed successfully:
- Yellow — The yellow portion of the ring chart indicates the percentage of completed workflows with a Status of Completed.
- Green — The green portion of the ring chart indicates the percentage of completed workflows with a Status of Success.
- Yellow — The yellow portion of the ring chart indicates the percentage of completed workflows with a Status of Completed.
- Unsuccessful
- The center of the Unsuccessful ring chart indicates the number of workflows that did not complete successfully:
- Orange — The orange portion of the ring chart indicates the percentage of workflows that completed with a Status of Canceled.
- Red — The red portion of the ring chart indicates the percentage of workflows that completed with a Status of Failed.
- Dark Red — The dark red portion of the ring chart indicates the percentage of workflows that completed with a Status of Timed-Out.
- Orange — The orange portion of the ring chart indicates the percentage of workflows that completed with a Status of Canceled.
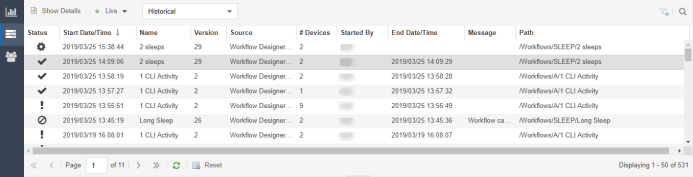
Workflow Results
The Workflow Results table displays details about the workflows you run. Select a color in one of the ring charts to filter the table to display the workflows with a Status that matches the Status selected.
- Execution ID
- An ID number that refers to the execution of the workflow. This ID number allows you to determine a workflow executed from a location other than the Workflows tab (for example, a third-party application via the Northbound Interface).
- Show Details
- Select a row in the table and select Show Details to open the workflow in the Workflow Details tab. Double-clicking a workflow also opens it in the Workflow Details tab.
- Update
- Select the Update drop-down icon at the top of the table to select whether the workflows in the table update automatically:
- Live — ExtremeCloud IQ Site Engine automatically updates the workflows in the table with any changes and new workflows display as they run.
- Live (Current Page) — ExtremeCloud IQ Site Engine updates the workflows currently in the table, but does not include new workflows as they run.
- Paused — ExtremeCloud IQ Site Engine does not update the workflows in the table.
- Type
- Select the Type drop-down icon at the top of the table to select whether the table displays currently running workflows or completed workflows:
- Active — The table displays currently running workflows. Selecting the Active Workflows ring chart automatically changes this drop-down list to Active.
- Historical — The table displays workflows that are not currently running. This includes workflows that completed successfully, failed, timed out, or are canceled. Selecting the Completed or Failed Workflows ring charts automatically changes this drop-down list to Historical.
- Status
- Indicates whether the workflow completed successfully, partially completed, timed out, failed, or canceled:
- SUCCESS (
 ) — Indicates the workflow completed successfully and all Activities within the workflow succeeded.
 - COMPLETED (
 ) — Indicates the workflow completed successfully, but not all Activities within the workflow succeeded.
 - TIMEDOUT (
 ) — Indicates the workflow did not complete in the amount of time configured in the Timeout field on the Inputs tab for the workflow.
 - FAILED (
 ) — Indicates the workflow did not complete successfully.
 - CANCELED (
 ) — Indicates a user canceled the workflow while it was running.
- SUCCESS (
- Version
- Displays the version of the workflow run on the devices. Each time you edit the workflow, the Version is incremented. This allows you to determine the exact workflow run on a device, even if the workflow is modified. For example, if you configure a workflow as a Scheduled Task (version 1) and then make a modification to the workflow (version 2), the version indicates the iteration of the workflow you are running.
- Source
- Displays the source from which the workflow ran. Workflow sources can be one of the following:
- Description
- A description of the workflow. This is defined on the General tab in the Details section of the Workflows tab.
- End Date/Time
- Displays the date and time the workflow ended.
- Message
- Displays information regarding the reason for the Status (for example, Exceeded default time out).
Select the Refresh icon to update the Workflow Results table to include any newly executed workflows.
Workflow Details
The Workflow Details tab displays when you double-click a workflow in the Workflow Results table of the Workflow Dashboard tab.
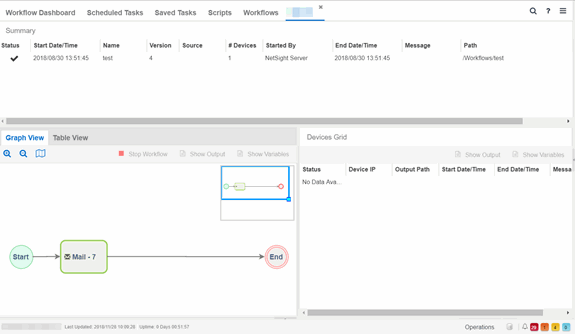
The Workflow Details view contains three sections:
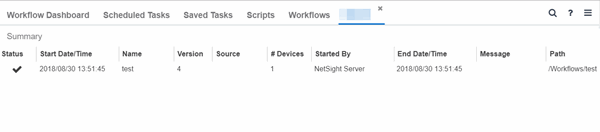
Workflow Summary
The Workflow Summary table provides basic information about the workflow you select in the Workflow Results table.
- ID
- A system-defined ID number for the workflow.
- Status
- Indicates whether the workflow completed successfully, partially completed, timed out, or failed:
- SUCCESS () — Indicates the workflow completed successfully and all Activities within the workflow succeeded.
- COMPLETED () — Indicates the workflow completed successfully, but not all Activities within the workflow succeeded.
- TIMEDOUT () — Indicates the workflow did not complete in the amount of time configured in the Timeout field on the Inputs tab for the workflow.
- FAILED () — Indicates the workflow did not complete successfully.
- CANCELED () — Indicates a user canceled the workflow while it was running.
- SUCCESS (
- Start Date/Time
- Displays the date and time the workflow started.
- Name
- Displays the name of the workflow.
- Version
- Displays the version of the workflow run on the devices. Each time you edit the workflow, the Version is incremented. This allows you to determine the exact workflow run on a device, even if the workflow is modified. For example, if you configure a workflow as a Scheduled Task (version 1) and then make a modification to the workflow (version 2), the version indicates the iteration of the workflow you are running.
- Source
- Displays the source from which the workflow ran. Workflows can be initiated from the following features:
- # Devices
- Displays the number of devices on which the workflow is executed.
- Description
- A description of the workflow. This is defined on the General tab in the Details section of the Workflows tab.
- Started By
- Displays the user who initiated the workflow.
- End Date/Time
- Displays the date and time the workflow ended.
- Message
- Displays information regarding the reason for the Status (for example, Exceeded default time out).
- Path
- Displays the path on the Workflows tab in which the workflow is saved.
Activities
The Activities section displays details about each of the activities in the workflow you select in the Workflow Results table. It contains two tabs - graphical and tabular - each providing a different view of the workflow:
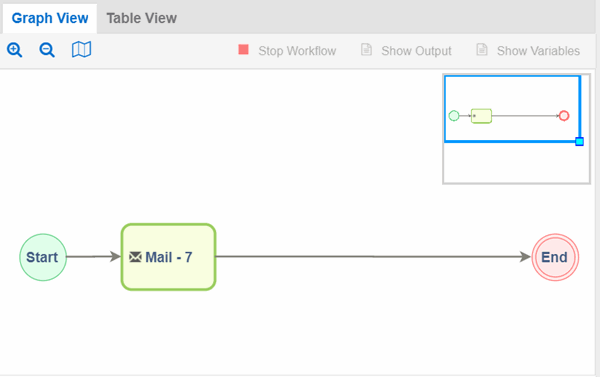
Graph View
The Graph View tab provides a visual representation of active or historical workflows. This allows you to view the workflow version ExtremeCloud IQ Site Engine is using or did use when executing the workflow, regardless of the difference between the version run and the current version.
The Graph View includes the following features:
Use the buttons at the top of the Graph View tab to perform the following functions:
- Zoom (
 ) - Use to zoom in and out of the graph view.
 - Toggle Mini Map (
 )- Opens a mini map displaying an overview of the entire workflow.
 - Stop Workflow - Select to stop an active workflow currently running.
- Show Output - Select an activity and select to open a new window displaying the output generated by the activity. This information is also contained in the text file found in the Output Path on the device.
- Show Variables - Select an activity and select to open a new window displaying the variables included in the activity.
| NOTE: | If a workflow is run against more than one device, select the activity in the Graph or Table View and then select the device in the Devices Grid and use the Show Output and Show Variables buttons in that area. |
The mini map view displays the workflow run and the surrounding space in the graph view area.
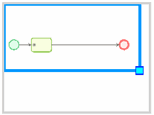
To move the area of focus in the graph view, move the cursor over the blue focus box in the mini map until the cursor changes to a Move icon ( ). Select the blue focus box and move it in the mini map to the area on which you want to focus the Designer. Additionally, you can shrink or expand the blue focus box to automatically zoom in or out of the workflow, respectively. Select the light-blue box in the bottom-right corner of the blue focus box and resize the blue focus box as needed.
The Graph View tab displays active and historical workflows as workflow runs. Select each element in the workflow run to display details about that element in the Devices Grid. When you select an activity in the workflow run, it is selected in the Table View as well. Selected items display with a green broken line border:
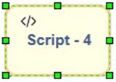
Activities that are active and currently being executed display in the workflow run in blue and are flashing. When the workflow finishes executing, the activity output and execution path taken is displayed in the workflow run.
The color of the activity represents its status in the workflow run:
 |
Green | The activity completed successfully. |
|
Orange | A user canceled the activity. |
|
Blue | The activity is active. |
|
Red | The activity failed to complete. |
|
Grey | The workflow skipped the activity. |
Table View
The Table View tab provides the results of each activity in the workflow selected in the Workflow Results section as a table.
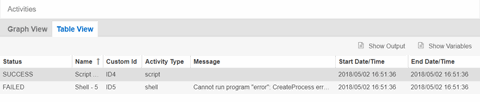
- Status
- Indicates the result of the activity (for example, SUCCESS, FAILED, TIMEDOUT, CANCELED).
- Name
- Displays the name of the activity.
- Custom ID
- A user-defined ID number for the selected activity.
- History ID
- A system-defined ID number for the selected activity.
- Activity Type
- The type of activity (e.g. script) run as part of the workflow.
- Description
- A description of the activity. This is defined on the General tab in the Details section of the Workflows tab.
- Message
- Displays information regarding the reason for the Status (for example, Exceeded default time out).
- Start Date/Time
- Displays the date and time the activity started.
- End Date/Time
- Displays the date and time the activity ended.
Select an activity and select the Show Output icon to open a new window displaying the output generated by the activity. This information is also contained in the text file found in the Output Path on the device. Select an activity and select the Show Variables icon to open a new window displaying the variables included in the activity. When you select an activity in the table, it is also selected in the workflow run in the Graph View tab and displays with a green broken line border.
Devices Grid
The Activity Device Results section of the window provides information about the devices on which the workflow ran.
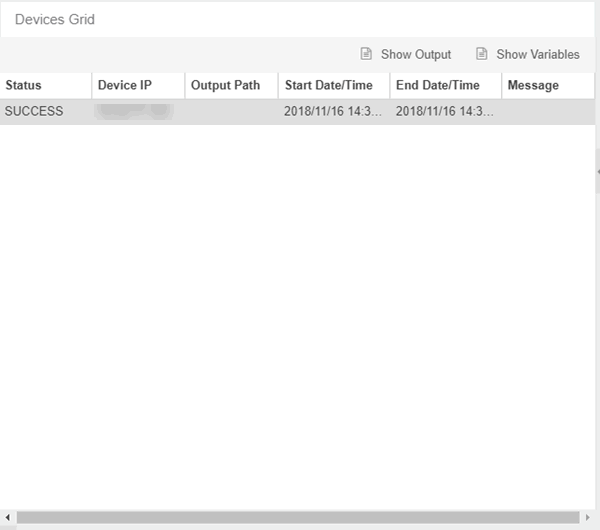
- Status
- Indicates result of the workflow (for example, SUCCESS, FAILED, TIMEDOUT, CANCELED) for the device. SKIPPED indicates the workflow ran on a device on which the operating system defined in the Network OS tab is not installed.
- Output Path
- The path on the device where a text file is created that displays the output generated on the device by the workflow.
Buttons
Use the buttons at the top of the Table View tab to perform the following functions:
- Show Output - Select an activity and select to open a new window displaying the output generated by the activity. This information is also contained in the text file found in the Output Path on the device.
- Show Variables - Select an activity and select to open the Variables window, which displays the variables included in the activity. Double-click a variable in the window to open the Variable Details window, which displays the Name and Value of the variable and allows you to copy and paste the information.
| NOTE: | If a workflow is run against more than one device, select the activity in the Graph or Table View and then select the device in the Devices Grid and use the Show Output and Show Variables buttons in that area. |
For information on related help topics:
![]()