The ExtremeCloud IQ Site Engine Map Tab gives you access to a number of powerful tools that will allow you to create, view, import, edit and search maps of devices and floor plans of wireless access points (APs) on your network. Maps are configured in various places on the Network > Devices tab. This topic shows you how to navigate the Map Tab and its many tools and features.
To view or search maps, you must be a member of an authorization group assigned the OneView > Maps > Maps Read Access or Maps Read/Write Access capability.
To access maps of your devices:
- Launch ExtremeCloud IQ Site Engine.
- Select the Network > Devices tab.
- Select Sites from the left-panel drop-down list. Sites are groups of devices that share a configuration. Within each site, you can add maps for devices, depending on their physical location.
- Expand a site from the left-panel tree to display the maps on that site.
- Select a map to open the Map Name tab in the right panel.
World Map Navigation Tree
Select the World Map tree in the left-panel. As you create your maps, they appear in the navigation tree, nested under the map you configure as the Parent Map.
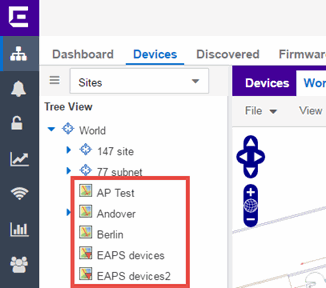
As shown in the image above, you also have the ability to nest maps within other maps. This allows you to organize certain maps as a subset of other maps (for example, creating a building map and then creating a map for each of the floors of the building).
Create Map
Right-click a map in the left-panel navigation tree and select Maps > Create New Map to create a new map. The first map you create is nested under the World Map. All subsequent maps are nested under the map you right-click when creating the new map.
Edit Map
Right-click a map in the navigation tree and select Maps > Edit Map to open an existing map in edit mode. Edit mode allows you to add new or move existing devices, APs, and map links on a map.
Import Map
You can also import a saved map by right-clicking a map in the navigation tree and selecting Maps > Import Map. This opens the Import Map window.
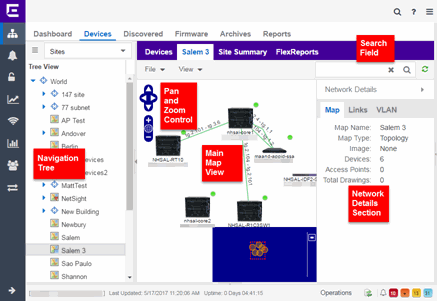
Main Map View
The Main Map view displays your map with all of the devices, network connections, links, or APs, depending on the type of map.
In the Main Map view, you can reorganize the orientation of elements in your map and view the status and details of the elements within the map. The Main Map view also contains the following controls for working with maps:
File, View, and Tool Menus
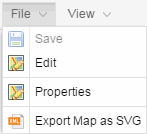
File Menu
The File menu allows you to change the map information, the devices, APs, and links displayed on the map, and export the map from ExtremeCloud IQ Site Engine.
| NOTE: |
To change the image used for a device type in a map, right-click the device and select Customize Device Type Image. The Upload Custom Device Type Image window appears where you can drag and drop the new image file. The height and width of image files must be less than 1,000 pixels. |
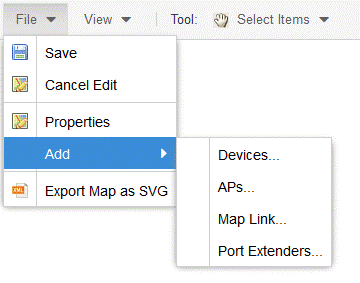
Selecting Edit opens the map in Edit mode and the Add menu is available, as shown below.
Selecting Properties opens the Map Properties window, which allows you to view and edit information about the map, including the map type, name, and background image. With an NMS-ADV license, the Export Map as SVG and Export Map as ZIP options are available in the File menu, which allow you to export the map in SVG or ZIP format, respectively.
When exporting a map in SVG format, the exported SVG file may open in a new tab or window, depending on how your browser is configured. The SVG file displays your exact view when you select Export Map as SVG. For example, if your map is zoomed in to only show two devices and the VLANs associated with those devices, your SVG file is identical to the view on your screen; displaying the two devices surrounded by boxes containing the VLAN names. To save the SVG file locally, right-click the map and select Save as.
Only floorplan maps can be exported as a ZIP file. Floorplan maps you export as a ZIP file are typically used to import a floorplan into another instance of ExtremeCloud IQ Site Engine.
Additionally, by selecting Edit in the File menu, the map changes to Edit mode and the Add submenu is available, from which you can add devices, APs, and map links to the map. Edit mode also allows you to manipulate the existing devices, APs, and map links currently displayed on the map. Select Cancel Edit to exit Edit mode. If you made any changes to the map, a dialog box appears from which you can choose to save the changes or exit Edit mode without saving your changes.
View Menu
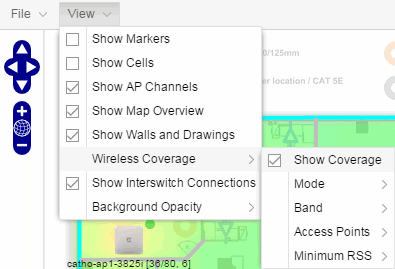
The View menu allows you to show or hide parts of your map. The options in the View menu do not change the information in the map, only allow you to show or hide additional information.
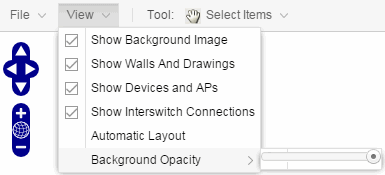
These options vary depending on the map Type. For example, floorplan maps display additional options, including the image you selected as the background of your map, the grid cells that establish the scale of the floorplan, the AP channels for floorplans, the map overview, the walls and drawings of the building, the wireless coverage within a floorplan, the interswitch connections, and the opacity of the background image.
Tool Menu
The Tool menu allows you to add lines and shapes to your maps. The following table includes descriptions of the various drawing tools accessed from the Tool menu.
| Drawing Tool | Definition |
|---|---|

|
Select Items
Select a line or shape for dragging or modification. Use the yellow drag handle to reposition the item; use the blue vertex to modify the shape. Select anywhere on the map and drag to reposition the map image. |

|
Draw Polygon
Position your cursor where you want to start drawing the polygon shape. Select and draw the first line of the polygon. Select each corner of the polygon. Double-click to release the polygon line. When you are finished drawing, right-click to release the draw polygon tool. |

|
Draw Rectangle
Position the cursor where you want the rectangle. Select and drag to draw the rectangle. When you are finished drawing, right-click to release the draw rectangle tool. |

|
Add Text
Select the map to open the Enter Text window. When you are finished entering your text, select OK. Position the cursor where you want to place the text and select to add the text to your map. Use the Style menu to change the text appearance. |

|
Draw Triangle
Position the cursor where you want the triangle. Select and drag to draw the triangle. When you are finished drawing, right-click to release the draw triangle tool. |

|
Draw Line
Position your cursor where you want to start drawing the line. Select and draw the line. Select to change line direction. While drawing, press the Delete key to delete the last vertex in the line. Double-click to release the line. When you are finished drawing, right-click to release the draw line tool. |

|
Rotate Shape Select the shape you want to rotate. Use the blue handle to rotate the shape to the desired position. (You can also right-click on an image and select Rotate Shape from the menu.) |
Pan and Zoom Control
Pan Control

The Pan control allows you to move left/right and up/down in the map. You can also change the position of the map by selecting and dragging the map in any direction.
Zoom Control

The Zoom control lets you zoom in and out of the map. You can also zoom in and out of the map by rotating the mouse scroll wheel forward and backward, respectively. Selecting the globe icon in the center of the Zoom control resets the zoom and positioning for the map to the last view configured in edit mode.
| NOTE: |
Changing the location and zoom using these controls and then saving the map saves those orientation changes to the map. |
Search Field
Use the Search field to search for a wireless client, an AP, or for a device or wired client. Enter a MAC address, IP address, hostname, user name, or AP serial number in the Search field and press Enter to start a search for a device or wired client.
Selecting the Refresh button  to the right of the Search field refreshes the map, including the position of mobile devices connected to an AP. When you select the Refresh button, the position of mobile devices updates according to their most recent location.
Viewing Alarm/Device Status
Maps display an integrated alarm/device status either to the right of a device or AP image, or incorporated as part of a map marker (if you have Show Markers selected from the map View menu). For example, the device below is down and a critical alarm is triggered (shown as a device image and as a marker).
![]()

Alarm status automatically updates every 30 seconds. Change this status refresh interval in the ExtremeCloud IQ Site Engine options (Administration > Options > OneView > Map).
-
 (Red) Critical — There is a critical alarm and the device is down.
 -
 (Orange) Error — There is a problem with limited implications on the device.
 -
 (Yellow) Warning — There is a condition that might lead to a problem on the device.
 -
 (Blue) Info — There is an information-only alarm on the device.
 -
 (Green) Clear — There are no alarms and the device is up.
Hover over a device or AP to view a pop-up that displays the IP address for a device or channels for an AP. Additionally, select the more link in the pop-up to access the Device View or additional information about the AP for a device or AP, respectively.
Accessing Device Information
There are two ways to access additional device information from a map.
Launch device information reports from a right-click menu on a device or AP in a map. The menu displays different options based on the device type. You must be in Edit mode to see the Remove From Map option.
Right-click on a device in a map and select Device View or right-click on an AP in a map and select AP Summary to open a Device View (like the example shown below) or AP PortView window where you can see a device image and other important device information.
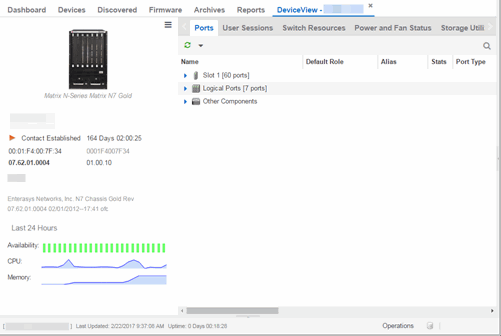
Additionally, the Device View and AP PortView windows contain tabs with additional information about the device or AP.
Link Information
Links are displayed on Topology maps as lines between devices in your network. The line colors indicate the state and status of the link:
| Color | Link State | Status |
|---|---|---|
| Green | Up | Operational |
| Red | Down | Not Operational |
| Yellow | Impaired | Partially Operational |
| Grey | Unknown | Operation Status Unknown |
Each connection type is represented by a different line style:
- Basic links appear as thin green lines with no outlining.
- Shared links appear as basic links when the EAPS domain is not highlighted and appear as thick green lines outlined by a black solid line when you highlight the associated EAPS domain.
- Lag links also appear as thick green lines outlined by a black solid line, but are thicker than shared links and display regardless of what you highlight.
- Blocked links appear as a thin green line (similar to a Basic link) outlined by a dashed black line with a red ball icon on the end of the link where the port is blocked when you highlight the associated EAPS domain. Blocked links with both ports blocked display a red ball icon on both ends of the link. Blocked links appear as basic links when the EAPS domain is not highlighted.


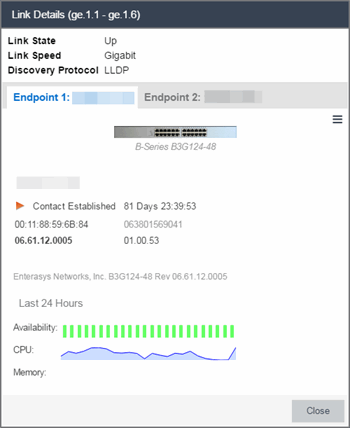
Double-clicking a connection opens the Link Details window from which you can view additional details about the network connection and the devices it links.
Network Details Section
The Network Details section is available in topology and geographic maps. It contains several tabs, depending on the devices included in the map:
- Map tab — Displays information about the map
- EAPS Summary tab — Lists information about any devices configured with Extreme's Ethernet Automatic Protection Switching feature
- Link Summary tab — Displays information about the network connections between devices
- VLAN Summary tab — Lists any virtual local area networks within the map
- MLAG Summary tab — Lists devices configured in a multi-switch link aggregation group
- VPLS Summary tab — Displays information about site connectivity within a private VLAN
- Extended Bridges tab — Displays the extended bridges within the map
For information on related help topics: